QUESTION IMAGE
Question
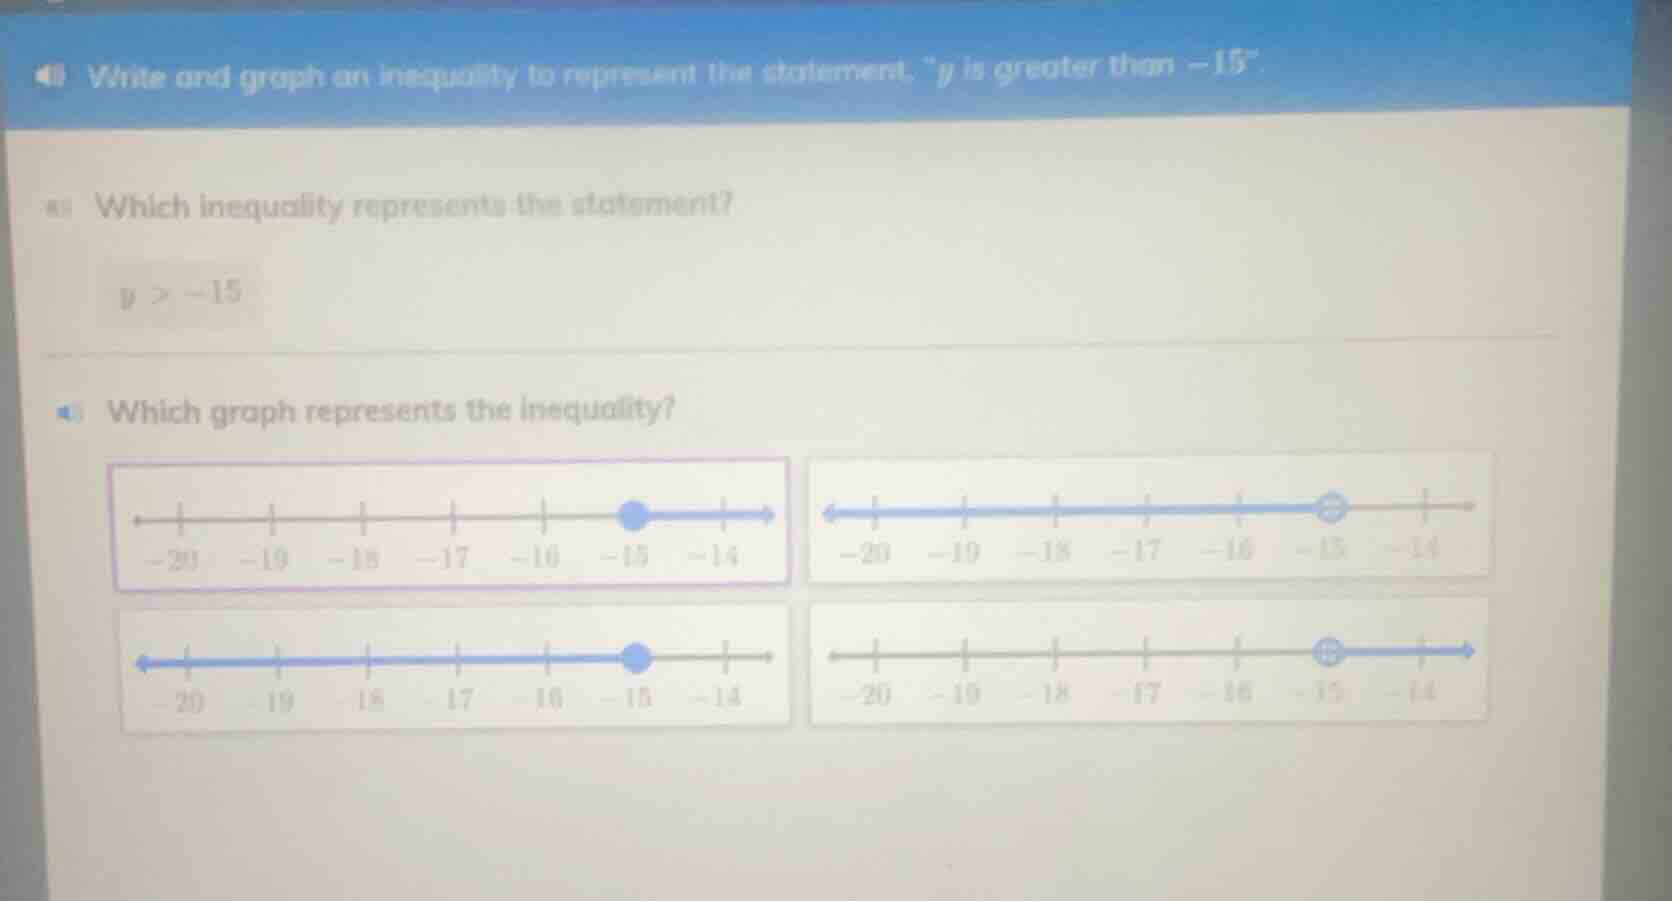
41 write and graph an inequality to represent the statement, \y is greater than -15\.
41a which inequality represents the statement?
y > -15
41b which graph represents the inequality?
(there are four number line graphs here, with labels -20, -19, -18, -17, -16, -15, -14 on each number line.)
Step1: Translate statement to inequality
The statement "y is greater than -15" translates directly to $y > -15$.
Step2: Identify correct number line graph
For $y > -15$, we use an open circle at $-15$ (since $-15$ is not included) and shade all values to the right (greater than $-15$).

Snap & solve any problem in the app
Get step-by-step solutions on Sovi AI
Photo-based solutions with guided steps
Explore more problems and detailed explanations
- The inequality is $y > -15$
- The correct graph is the top-right one: an open circle at -15 with the line shaded to the right towards -14, -13, etc.