QUESTION IMAGE
Question
44 algebra, functions, and data analysis
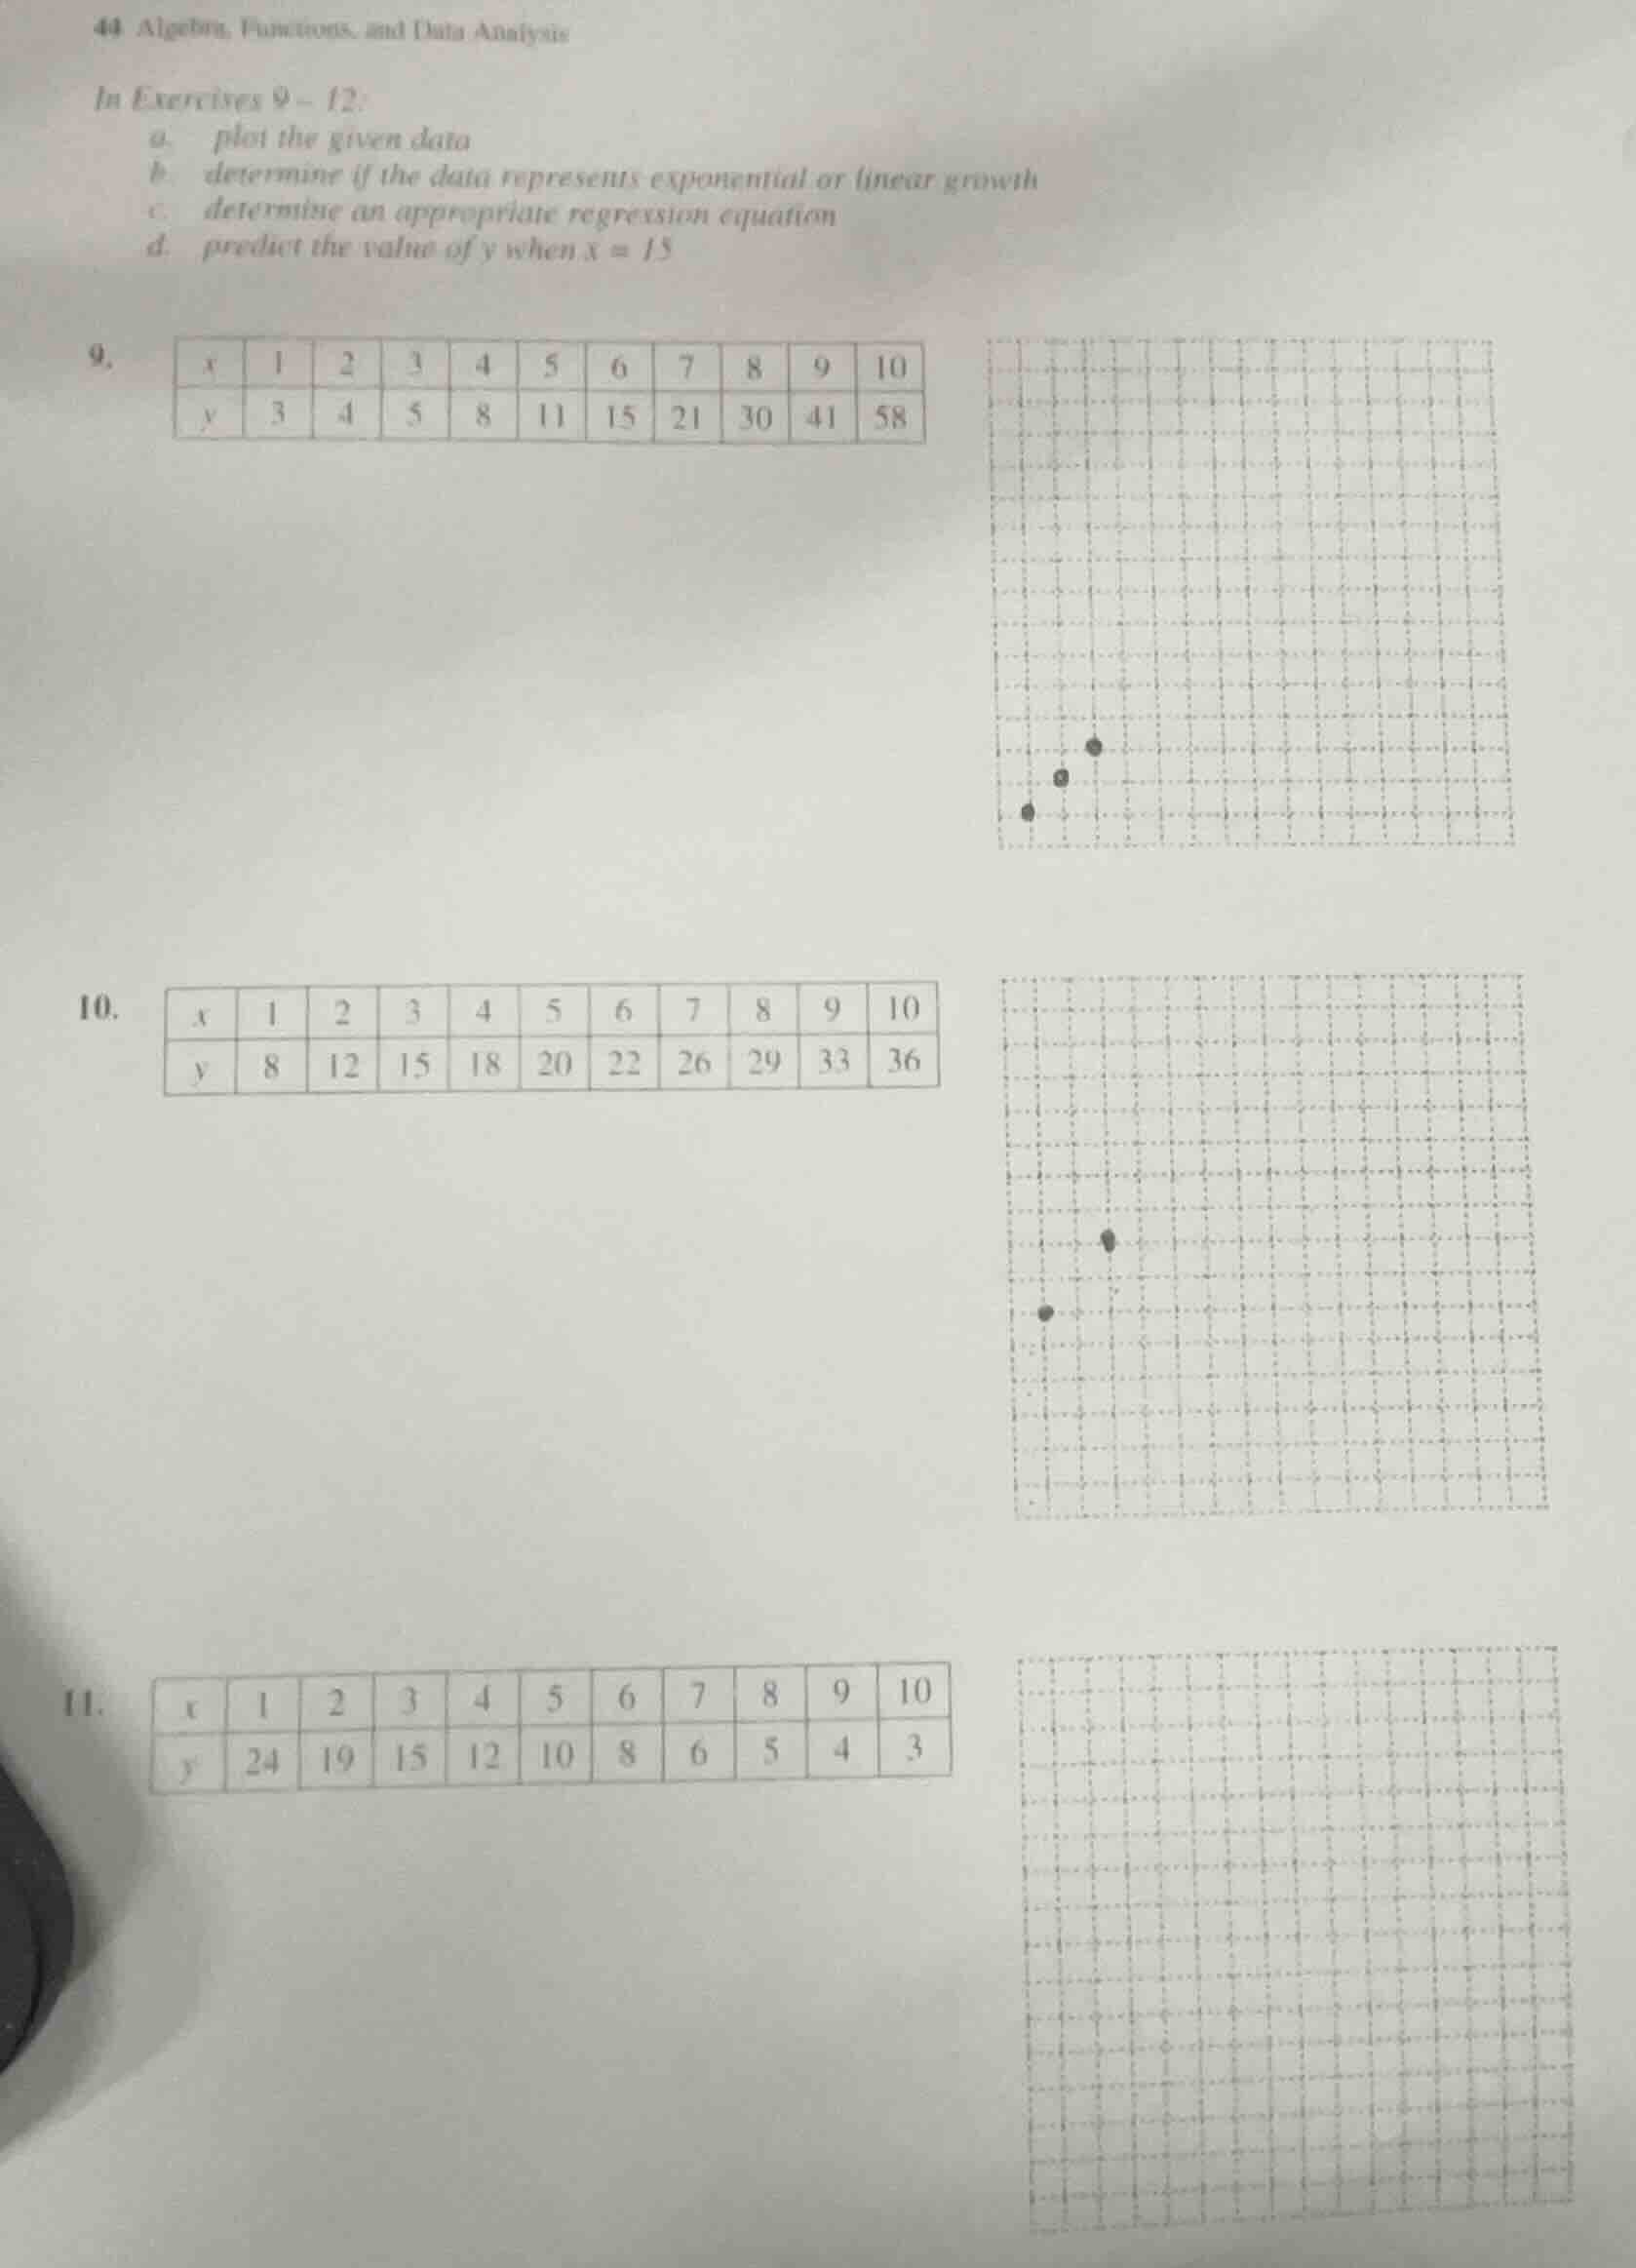
in exercises 9 - 12:
a. plot the given data
b. determine if the data represents exponential or linear growth
c. determine an appropriate regression equation
d. predict the value of y when x = 15
9.
| x | 1 | 2 | 3 | 4 | 5 | 6 | 7 | 8 | 9 | 10 |
| y | 3 | 4 | 5 | 8 | 11 | 15 | 21 | 30 | 41 | 58 |
10.
| x | 1 | 2 | 3 | 4 | 5 | 6 | 7 | 8 | 9 | 10 |
| y | 8 | 12 | 15 | 18 | 20 | 22 | 26 | 29 | 33 | 36 |
11.
| x | 1 | 2 | 3 | 4 | 5 | 6 | 7 | 8 | 9 | 10 |
| y | 24 | 19 | 15 | 12 | 10 | 8 | 6 | 5 | 4 | 3 |
For Exercise 9:
Step1: Analyze differences/ratios
First differences: $4-3=1, 5-4=1, 8-5=3, 11-8=3, 15-11=4, 21-15=6, 30-21=9, 41-30=11, 58-41=17$ (not constant)
Ratios of consecutive y-values: $\frac{4}{3}\approx1.33, \frac{5}{4}=1.25, \frac{8}{5}=1.6, \frac{11}{8}=1.375, \frac{15}{11}\approx1.36, \frac{21}{15}=1.4, \frac{30}{21}\approx1.43, \frac{41}{30}\approx1.37, \frac{58}{41}\approx1.41$ (approaching a constant, so exponential)
Step2: Find exponential regression
Using a calculator/stat tool for $y=ab^x$, we get $a\approx2.43$, $b\approx1.35$
Equation: $y\approx2.43(1.35)^x$
Step3: Predict y at x=15
Substitute $x=15$:
$y\approx2.43(1.35)^{15}$
$(1.35)^{15}\approx51.88$
$y\approx2.43\times51.88\approx126.07$
Step1: Analyze differences/ratios
First differences: $12-8=4, 15-12=3, 18-15=3, 20-18=2, 22-20=2, 26-22=4, 29-26=3, 33-29=4, 36-33=3$ (nearly constant, linear)
Step2: Find linear regression
Using $y=mx+b$, calculate $m=\frac{n\sum xy-\sum x\sum y}{n\sum x^2-(\sum x)^2}$, $b=\frac{\sum y - m\sum x}{n}$
$\sum x=55$, $\sum y=219$, $\sum xy=1363$, $\sum x^2=385$, $n=10$
$m=\frac{10\times1363 - 55\times219}{10\times385 - 55^2}=\frac{13630-12045}{3850-3025}=\frac{1585}{825}\approx1.92$
$b=\frac{219 - 1.92\times55}{10}=\frac{219-105.6}{10}\approx11.34$
Equation: $y\approx1.92x+11.34$
Step3: Predict y at x=15
Substitute $x=15$:
$y\approx1.92\times15 + 11.34=28.8+11.34=40.14$
Step1: Analyze differences/ratios
First differences: $19-24=-5, 15-19=-4, 12-15=-3, 10-12=-2, 8-10=-2, 6-8=-2, 5-6=-1, 4-5=-1, 3-4=-1$ (not constant)
Ratios of consecutive y-values: $\frac{19}{24}\approx0.79, \frac{15}{19}\approx0.79, \frac{12}{15}=0.8, \frac{10}{12}\approx0.83, \frac{8}{10}=0.8, \frac{6}{8}=0.75, \frac{5}{6}\approx0.83, \frac{4}{5}=0.8, \frac{3}{4}=0.75$ (approaching a constant, exponential decay)
Step2: Find exponential regression
Using $y=ab^x$, we get $a\approx26.6$, $b\approx0.85$
Equation: $y\approx26.6(0.85)^x$
Step3: Predict y at x=15
Substitute $x=15$:
$y\approx26.6(0.85)^{15}$
$(0.85)^{15}\approx0.087$
$y\approx26.6\times0.087\approx2.31$

Snap & solve any problem in the app
Get step-by-step solutions on Sovi AI
Photo-based solutions with guided steps
Explore more problems and detailed explanations
a. Plot points (1,3), (2,4), (3,5), (4,8), (5,11), (6,15), (7,21), (8,30), (9,41), (10,58) on the grid
b. Exponential growth
c. $y\approx2.43(1.35)^x$
d. $\approx126$
---