QUESTION IMAGE
Question
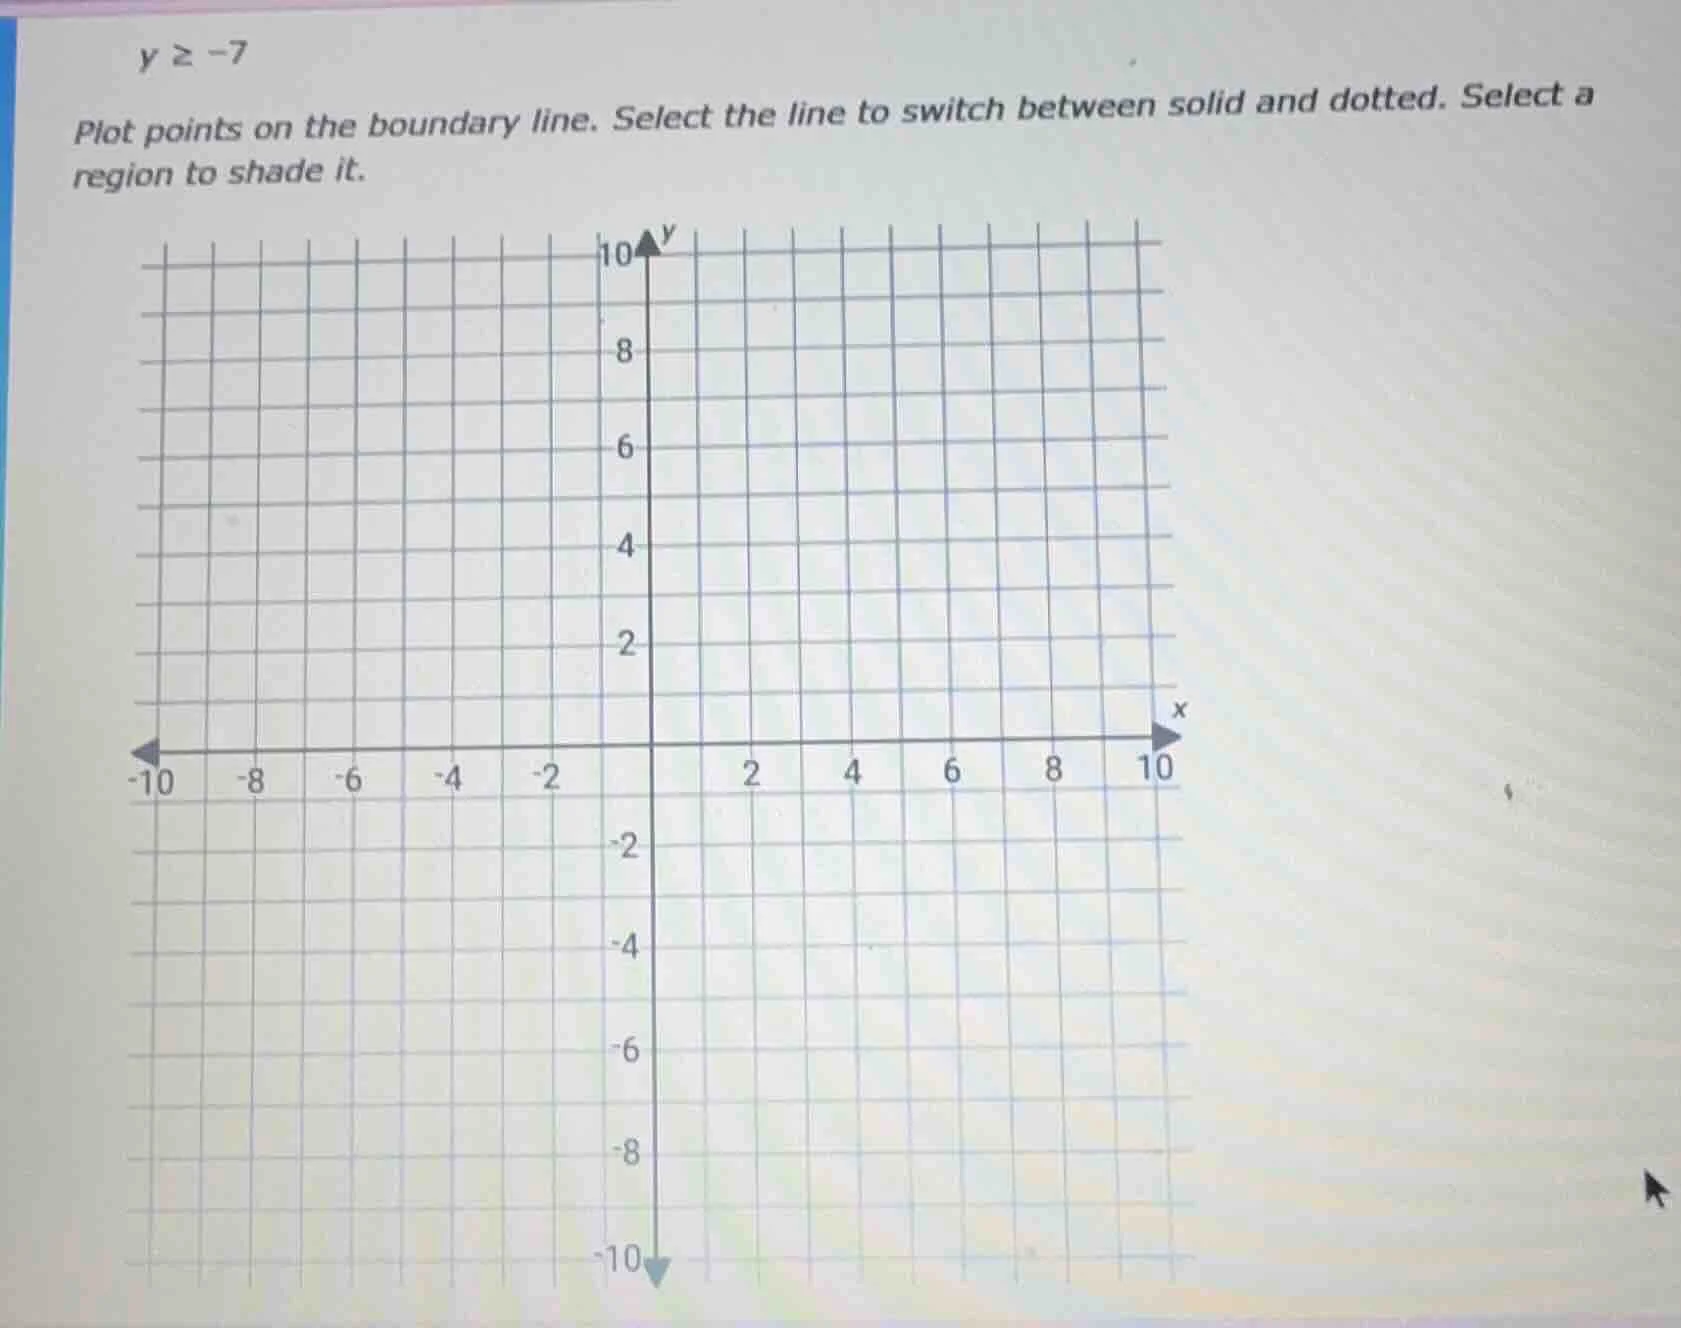
y ≥ -7
plot points on the boundary line. select the line to switch between solid and dotted. select a region to shade it.
Step1: Analyze the inequality
The inequality is \( y \geq -7 \). This represents all the points where the \( y \)-coordinate is greater than or equal to -7. The boundary line for this inequality is a horizontal line \( y = -7 \). Since the inequality is "greater than or equal to", the boundary line should be solid (to include the points on the line itself).
Step2: Plot the boundary line
To plot the line \( y = -7 \), we find the horizontal line that passes through \( y = -7 \) on the \( y \)-axis. This line will be parallel to the \( x \)-axis and will pass through all points with \( y \)-coordinate -7, regardless of the \( x \)-coordinate (e.g., (0, -7), (1, -7), (-1, -7), etc.).
Step3: Shade the region
We need to shade the region where \( y \geq -7 \). This means we shade the area above the line \( y = -7 \) (including the line itself, since the inequality is non-strict). So, we shade all the points that are on or above the horizontal line \( y = -7 \).

Snap & solve any problem in the app
Get step-by-step solutions on Sovi AI
Photo-based solutions with guided steps
Explore more problems and detailed explanations
- Boundary Line: Plot a solid horizontal line at \( y = -7 \) (passing through points like (0, -7), (2, -7), (-3, -7), etc.).
- Shaded Region: Shade the area above (and including) the line \( y = -7 \).