QUESTION IMAGE
Question
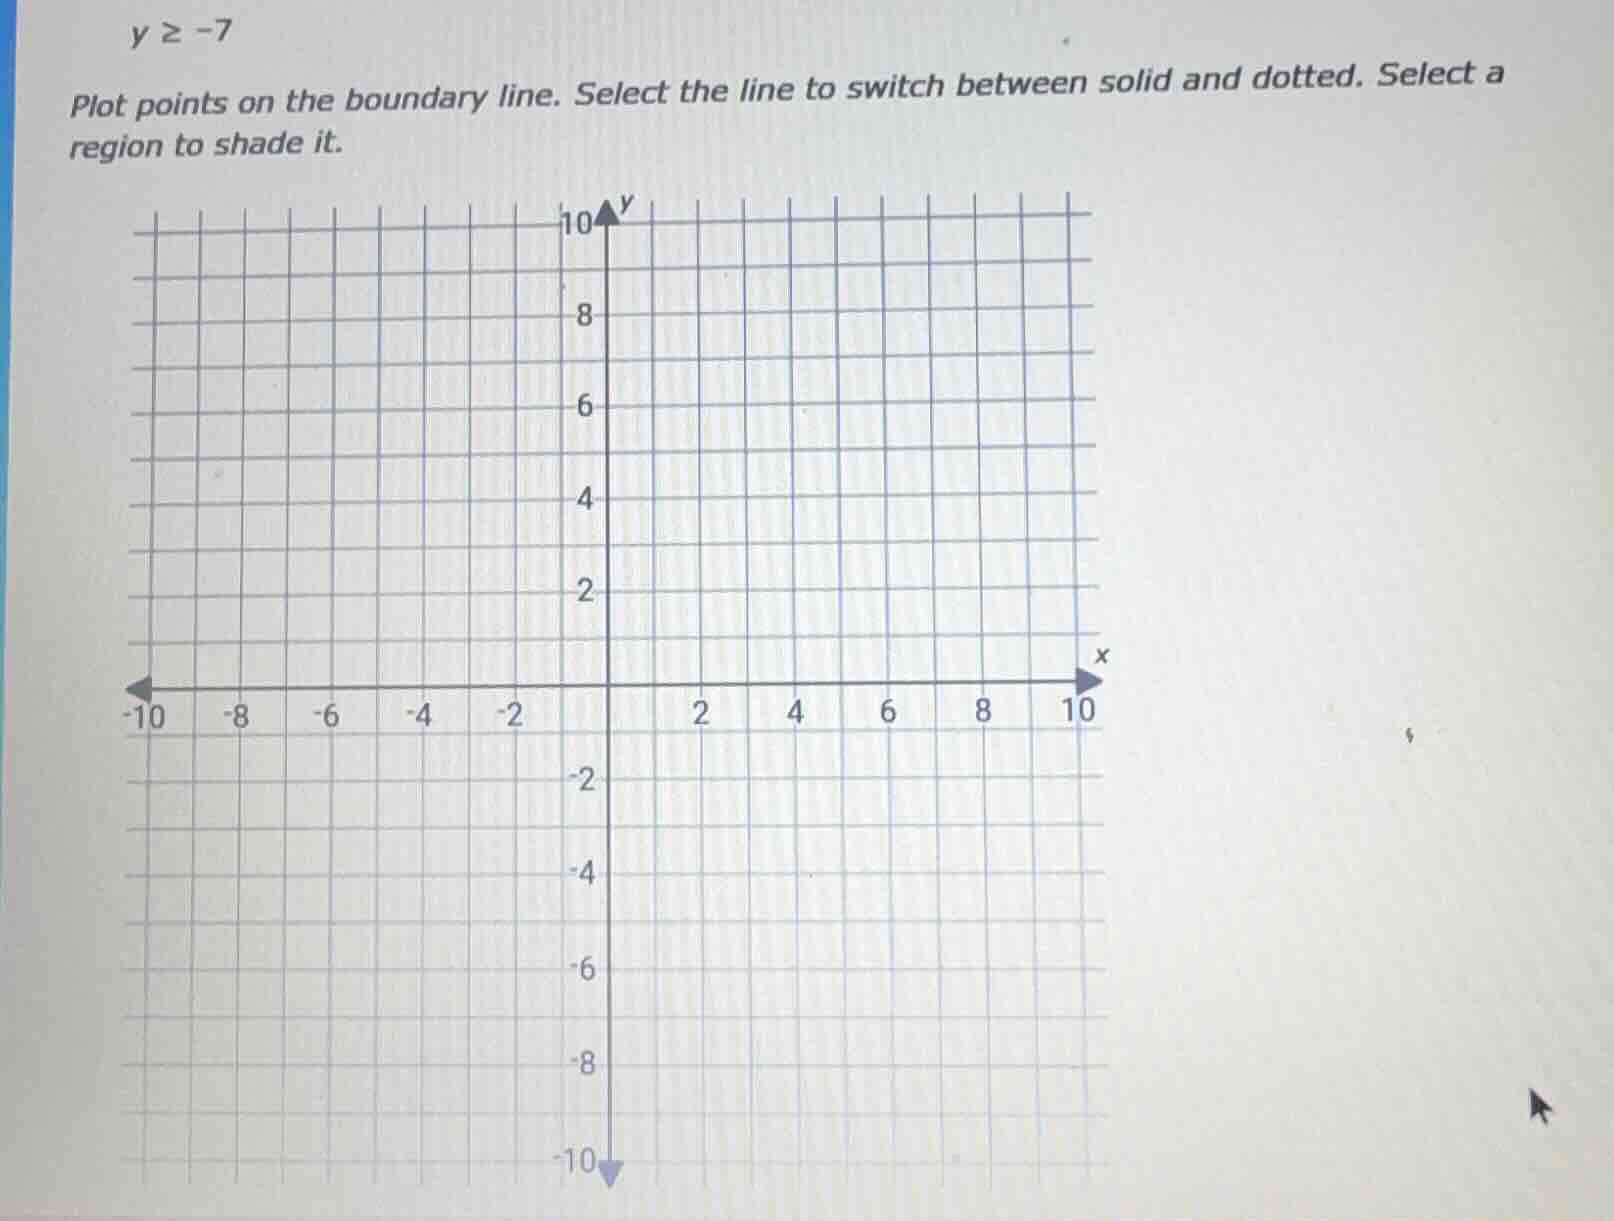
y ≥ -7
plot points on the boundary line. select the line to switch between solid and dotted. select a region to shade it.
Step1: Analyze the inequality
The inequality is \( y \geq -7 \). This is a horizontal line (since there is no \( x \) term) at \( y = -7 \). The "greater than or equal to" sign means the boundary line is solid (because equality is included) and we shade above the line (since \( y \) values greater than or equal to -7 are above \( y = -7 \) on the coordinate plane).
Step2: Plot the boundary line
To plot the boundary line \( y = -7 \), we find the horizontal line where the \( y \)-coordinate is -7. On the given grid, this line is 7 units below the origin (since \( y = 0 \) is the x-axis, moving down 7 units gives \( y = -7 \)). We draw a solid line along \( y = -7 \) (since the inequality is \( \geq \), the line is included in the solution set).
Step3: Shade the region
Since the inequality is \( y \geq -7 \), we shade the region above the line \( y = -7 \). This includes all points where the \( y \)-coordinate is -7 or greater.

Snap & solve any problem in the app
Get step-by-step solutions on Sovi AI
Photo-based solutions with guided steps
Explore more problems and detailed explanations
- Draw a solid horizontal line at \( y = -7 \) (along the line where \( y = -7 \) on the grid).
- Shade the region above this line (including the line itself).