QUESTION IMAGE
Question
73 of 74 concepts completed
assignment is past due
fill in the blank question
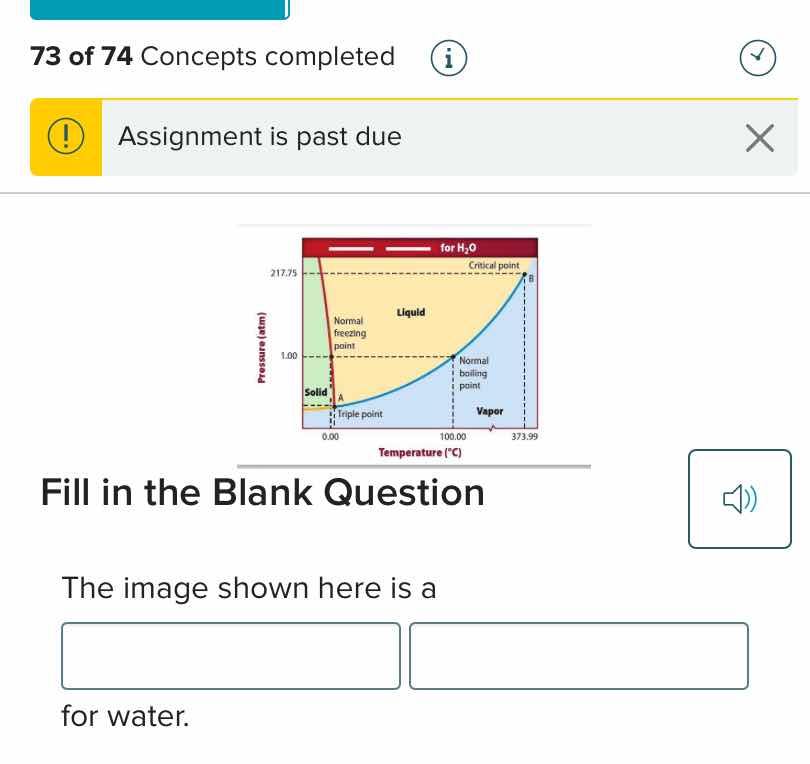
the image shown here is a
for water.
Brief Explanations
The image shows a graph with temperature (x - axis) and pressure (y - axis), and regions for solid, liquid, vapor of \(H_2O\), along with points like triple point, critical point, normal freezing and boiling points. This is a phase diagram, which is used to show the phases of a substance (here water) as a function of temperature and pressure.

Snap & solve any problem in the app
Get step-by-step solutions on Sovi AI
Photo-based solutions with guided steps
Explore more problems and detailed explanations
phase diagram