QUESTION IMAGE
Question
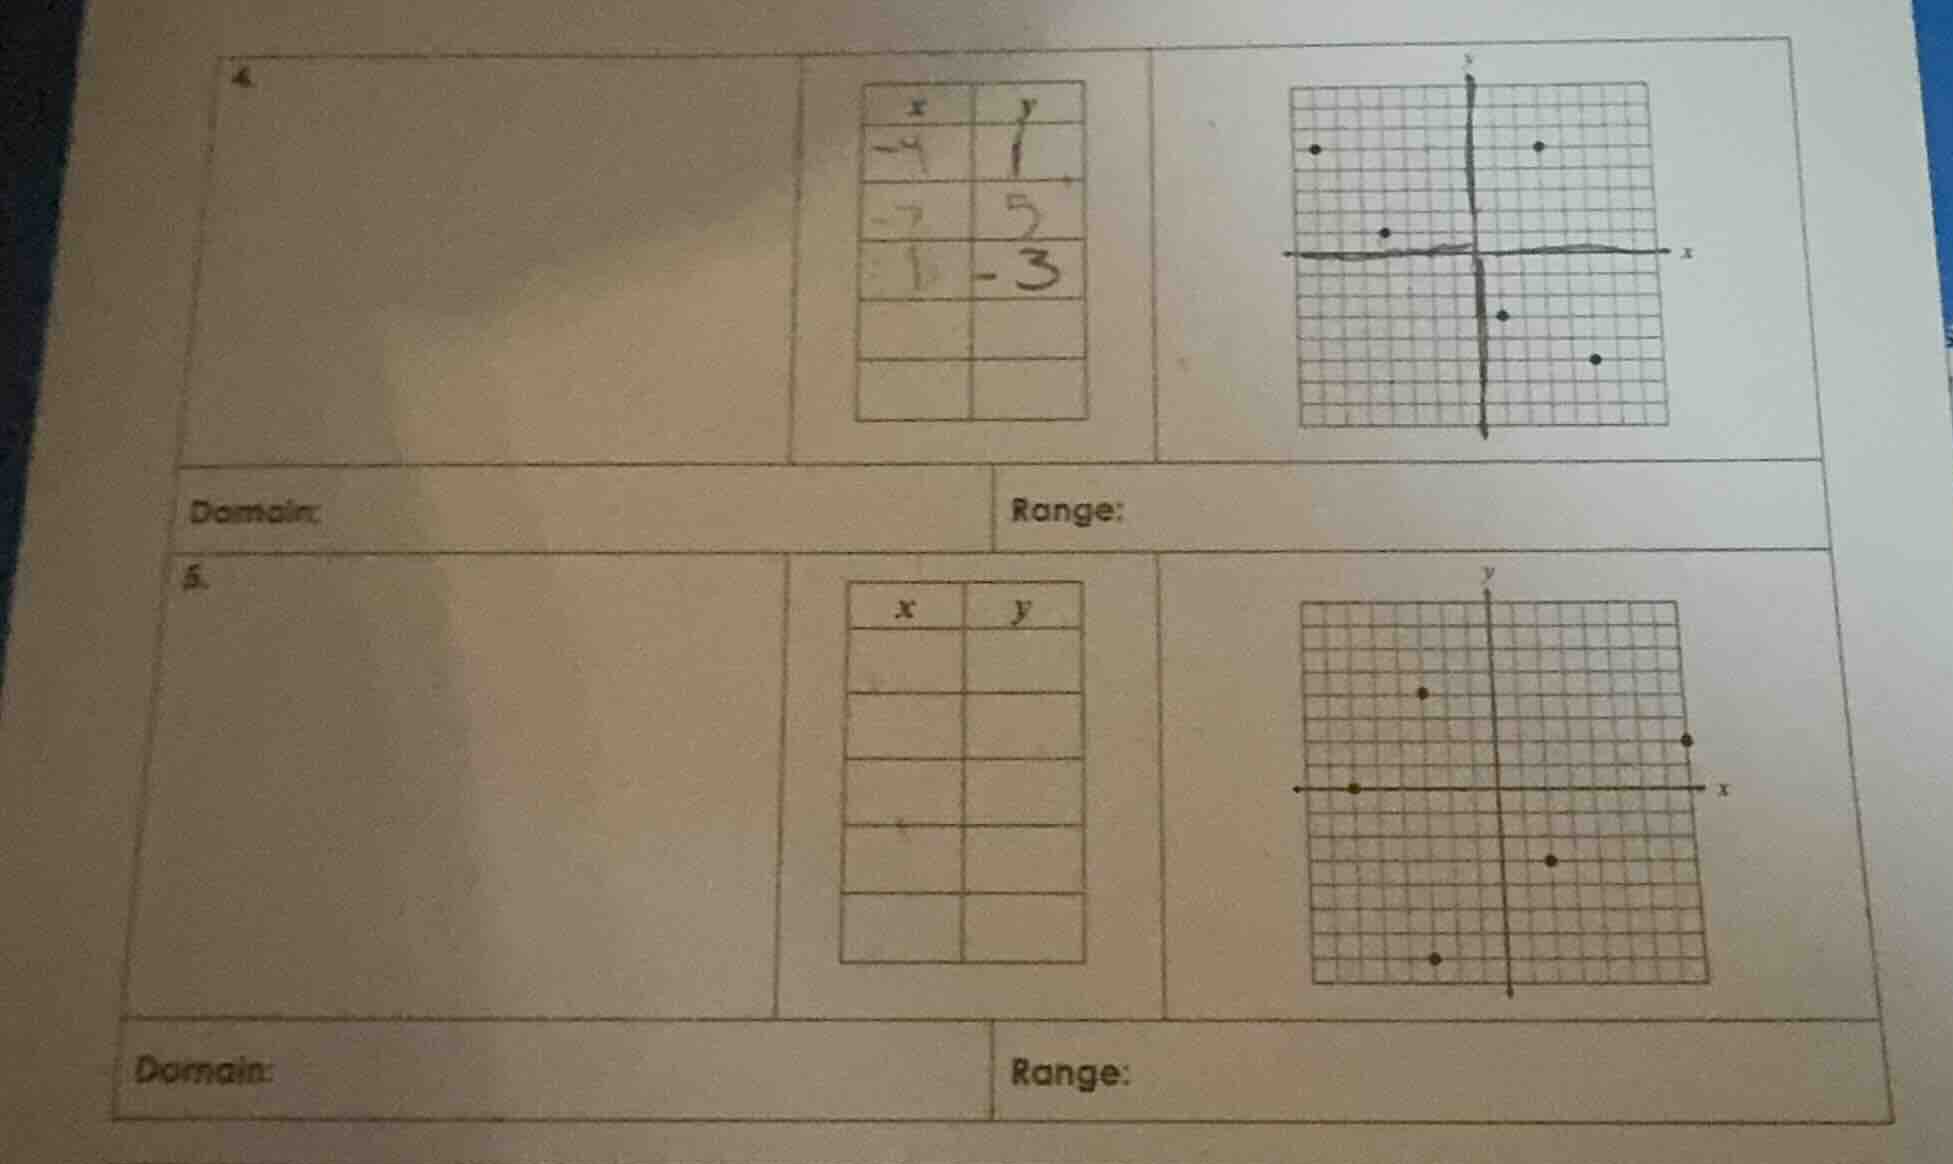
4.
| x | y |
| -9 | 1 |
| -7 | 5 |
| 1 | -3 |
(graph with points on coordinate plane)
domain:
range:
5.
| x | y |
(graph with points on coordinate plane)
domain:
range:
Problem 4
Step1: Identify x-values (Domain)
From the table, x-values are -9, -7, -1. From the graph, we can find other x - coordinates. Let's assume the points on the graph have x - coordinates (by looking at the grid, we can estimate). Let's say the points are at x = -8 (left top), x = 4 (right top), x = -3 (left middle), x = 2 (right bottom), x = 5 (bottom right). Wait, maybe better to list all x - values from table and graph. Table: -9, -7, -1. Graph: let's see the dots. Let's suppose the x - coordinates of the dots are -8, 4, -3, 2, 5. So combining table and graph, the domain (all x - values) are -9, -8, -7, -3, -1, 2, 4, 5. Wait, maybe the table has three points and the graph has five? Wait, the table has three rows (x: -9, -7, -1; y:1, 5, -3) and the graph has five dots. So we need to get all x - values (inputs) for domain and y - values (outputs) for range.
Step2: Identify y-values (Range)
From the table, y - values are 1, 5, -3. From the graph, the y - coordinates of the dots: let's say top left dot y = 4, top right dot y = 4, left middle dot y = 1, right bottom dot y = -2, bottom right dot y = -4. Wait, maybe better to list all y - values. Table: 1, 5, -3. Graph: let's assume the y - coordinates are 4, 4, 1, -2, -4. So range is all y - values: -4, -3, -2, 1, 4, 5.
Wait, maybe I made a mistake. Let's do it properly. Domain is the set of all x - coordinates (input values) of the points. Range is the set of all y - coordinates (output values) of the points.
From the table:
- When x = -9, y = 1
- When x = -7, y = 5
- When x = -1, y = -3
From the graph (assuming the dots are at the following coordinates, by counting grid squares):
- Let's say the left - most top dot: x = -8, y = 4
- Right - most top dot: x = 4, y = 4
- Left - middle dot: x = -3, y = 1
- Right - bottom dot: x = 2, y = -2
- Bottom - right dot: x = 5, y = -4
So combining all x - values (domain): -9, -8, -7, -3, -1, 2, 4, 5
Combining all y - values (range): -4, -3, -2, 1, 4, 5
Problem 5
Step1: Identify x-values (Domain)
We need to find all x - coordinates of the points from the graph (since the table is empty). Let's look at the graph. The dots are at: let's say (by counting grid squares) x = -6 (on x - axis), x = -4 (top left), x = 8 (right top), x = 3 (right middle), x = -5 (bottom left). So x - values (domain) are -6, -5, -4, 3, 8.
Step2: Identify y-values (Range)
Find all y - coordinates of the points. The dots: ( - 6, 0) (on x - axis), ( - 4, 3) (top left), (8, 1) (right top), (3, - 2) (right middle), ( - 5, - 4) (bottom left). So y - values (range) are -4, -2, 0, 1, 3.

Snap & solve any problem in the app
Get step-by-step solutions on Sovi AI
Photo-based solutions with guided steps
Explore more problems and detailed explanations
(Problem 4):
Domain: \(\{-9, -8, -7, -3, -1, 2, 4, 5\}\) (approximate, depending on graph interpretation)
Range: \(\{-4, -3, -2, 1, 4, 5\}\) (approximate, depending on graph interpretation)