QUESTION IMAGE
Question
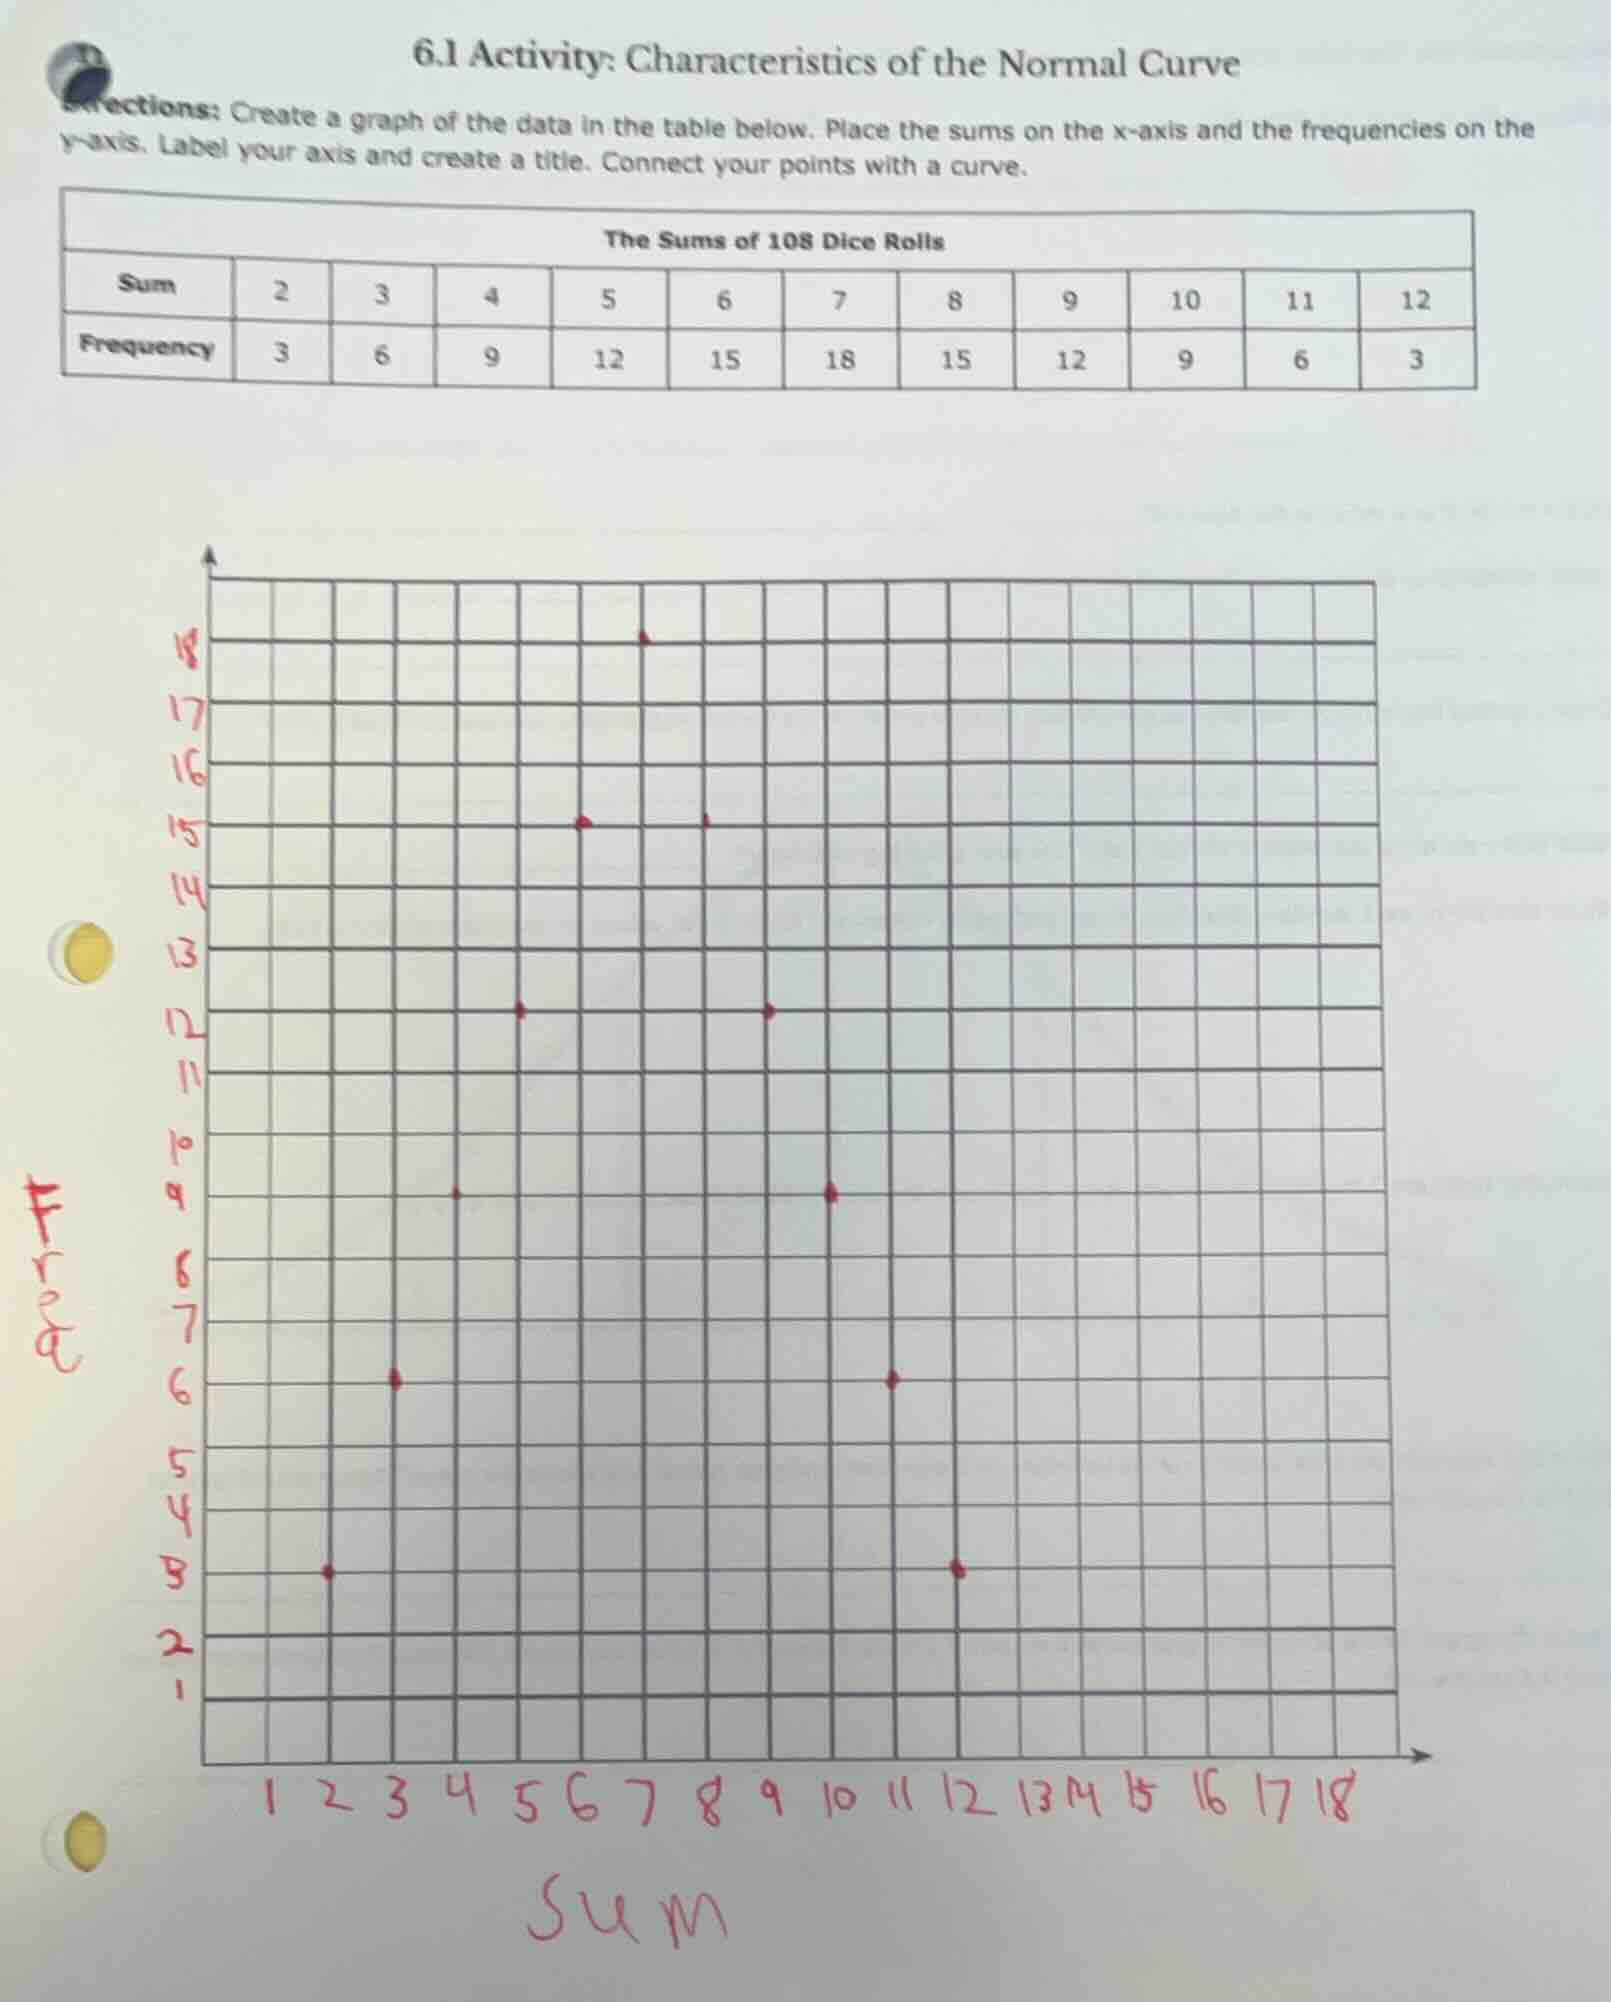
6.1 activity: characteristics of the normal curve
directions: create a graph of the data in the table below. place the sums on the x - axis and the frequencies on the y - axis. label your axis and create a title. connect your points with a curve.
the sums of 108 dice rolls
| sum | 2 | 3 | 4 | 5 | 6 | 7 | 8 | 9 | 10 | 11 | 12 |
| frequency | 3 | 6 | 9 | 12 | 15 | 18 | 15 | 12 | 9 | 6 | 3 |
Step1: Correct axis labeling
The x-axis should only include sums 2-12 (from the table), and the y-axis should be labeled "Frequency" (spelled correctly) with values 3-18 matching the table frequencies.
Step2: Verify plotted points
Confirm all (Sum, Frequency) pairs are plotted accurately:
$(2,3), (3,6), (4,9), (5,12), (6,15), (7,18), (8,15), (9,12), (10,9), (11,6), (12,3)$
Step3: Add title and connect points
Use the title "Frequency of Sums from 108 Dice Rolls", then connect the plotted points with a smooth curve.

Snap & solve any problem in the app
Get step-by-step solutions on Sovi AI
Photo-based solutions with guided steps
Explore more problems and detailed explanations
- Corrected Axes:
- X-axis: Labeled "Sum", marked with values 2, 3, 4, 5, 6, 7, 8, 9, 10, 11, 12
- Y-axis: Labeled "Frequency", marked with values 3, 6, 9, 12, 15, 18
- Accurately Plotted Points: All (Sum, Frequency) pairs from the table are plotted at the correct grid intersections.
- Final Graph: A smooth curve connects all plotted points, with the title "Frequency of Sums from 108 Dice Rolls" at the top. The resulting curve is symmetric, matching the shape of a normal curve.