QUESTION IMAGE
Question
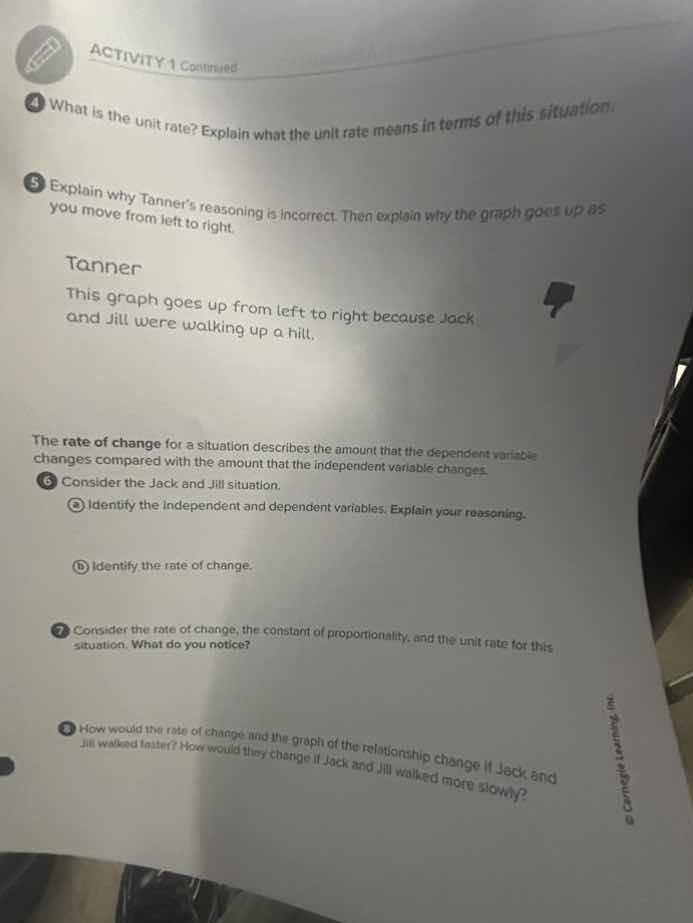
activity 1 continued
4 what is the unit rate? explain what the unit rate means in terms of this situation.
5 explain why tanner’s reasoning is incorrect. then explain why the graph goes up as you move from left to right.
tanner
this graph goes up from left to right because jack and jill were walking up a hill.
the rate of change for a situation describes the amount that the dependent variable changes compared with the amount that the independent variable changes.
6 consider the jack and jill situation.
a identify the independent and dependent variables. explain your reasoning.
b identify the rate of change.
7 consider the rate of change, the constant of proportionality, and the unit rate for this situation. what do you notice?
8 how would the rate of change and the graph of the relationship change if jack and jill walked faster? how would they change if jack and jill walked more slowly?
Since the problem set is about analyzing a situation (likely related to motion, like Jack and Jill walking) with concepts like unit rate, rate of change, independent/dependent variables, etc., but the specific details of the Jack and Jill situation (like what quantities are being measured, e.g., time and distance) aren't fully provided here, it's hard to solve each part without more context. However, I can give a general approach for a typical Jack and Jill walking scenario (assuming it's about distance vs. time):
For Question 5 (Explaining Tanner's incorrect reasoning and graph direction):
Tanner's reasoning is incorrect because a graph going up from left to right in a distance - time context (assuming the graph is distance vs. time) is due to the passage of time (independent variable) leading to an increase in distance (dependent variable) as they walk, not necessarily because they are walking up a hill. The graph's upward trend from left to right is a result of the rate of change (speed) being positive—distance increases as time increases when moving at a positive speed, regardless of the terrain's slope.
The independent variable is time (e.g., in minutes or hours) because time passes on its own and we can choose different time intervals to measure. The dependent variable is distance (e.g., in meters or miles) because the distance Jack and Jill cover depends on how much time has passed (they move at a certain speed, so distance = speed×time).
Step 1: Recall the formula for rate of change (speed)
The rate of change (speed) is calculated as $r=\frac{\text{Change in distance}}{\text{Change in time}}$, or $r = \frac{\Delta d}{\Delta t}$. If we have two points $(t_1,d_1)$ and $(t_2,d_2)$ on the distance - time graph, the rate of change (speed) $r=\frac{d_2 - d_1}{t_2 - t_1}$.
Step 2: Interpret in the scenario
In the Jack and Jill situation, if they walk at a constant speed, the rate of change is their speed (e.g., if they cover 5 meters in 1 minute, rate of change is 5 meters per minute).

Snap & solve any problem in the app
Get step-by-step solutions on Sovi AI
Photo-based solutions with guided steps
Explore more problems and detailed explanations
Tanner is incorrect because the graph’s upward trend (left - to - right) in a distance - time graph (assuming) is due to distance increasing with time as they walk (positive speed), not the hill. The graph rises as time (x - axis, left - to - right) increases, so distance (y - axis) increases as they move over time.
For Question 6a (Identifying independent and dependent variables):
In a typical walking scenario (distance vs. time):