QUESTION IMAGE
Question
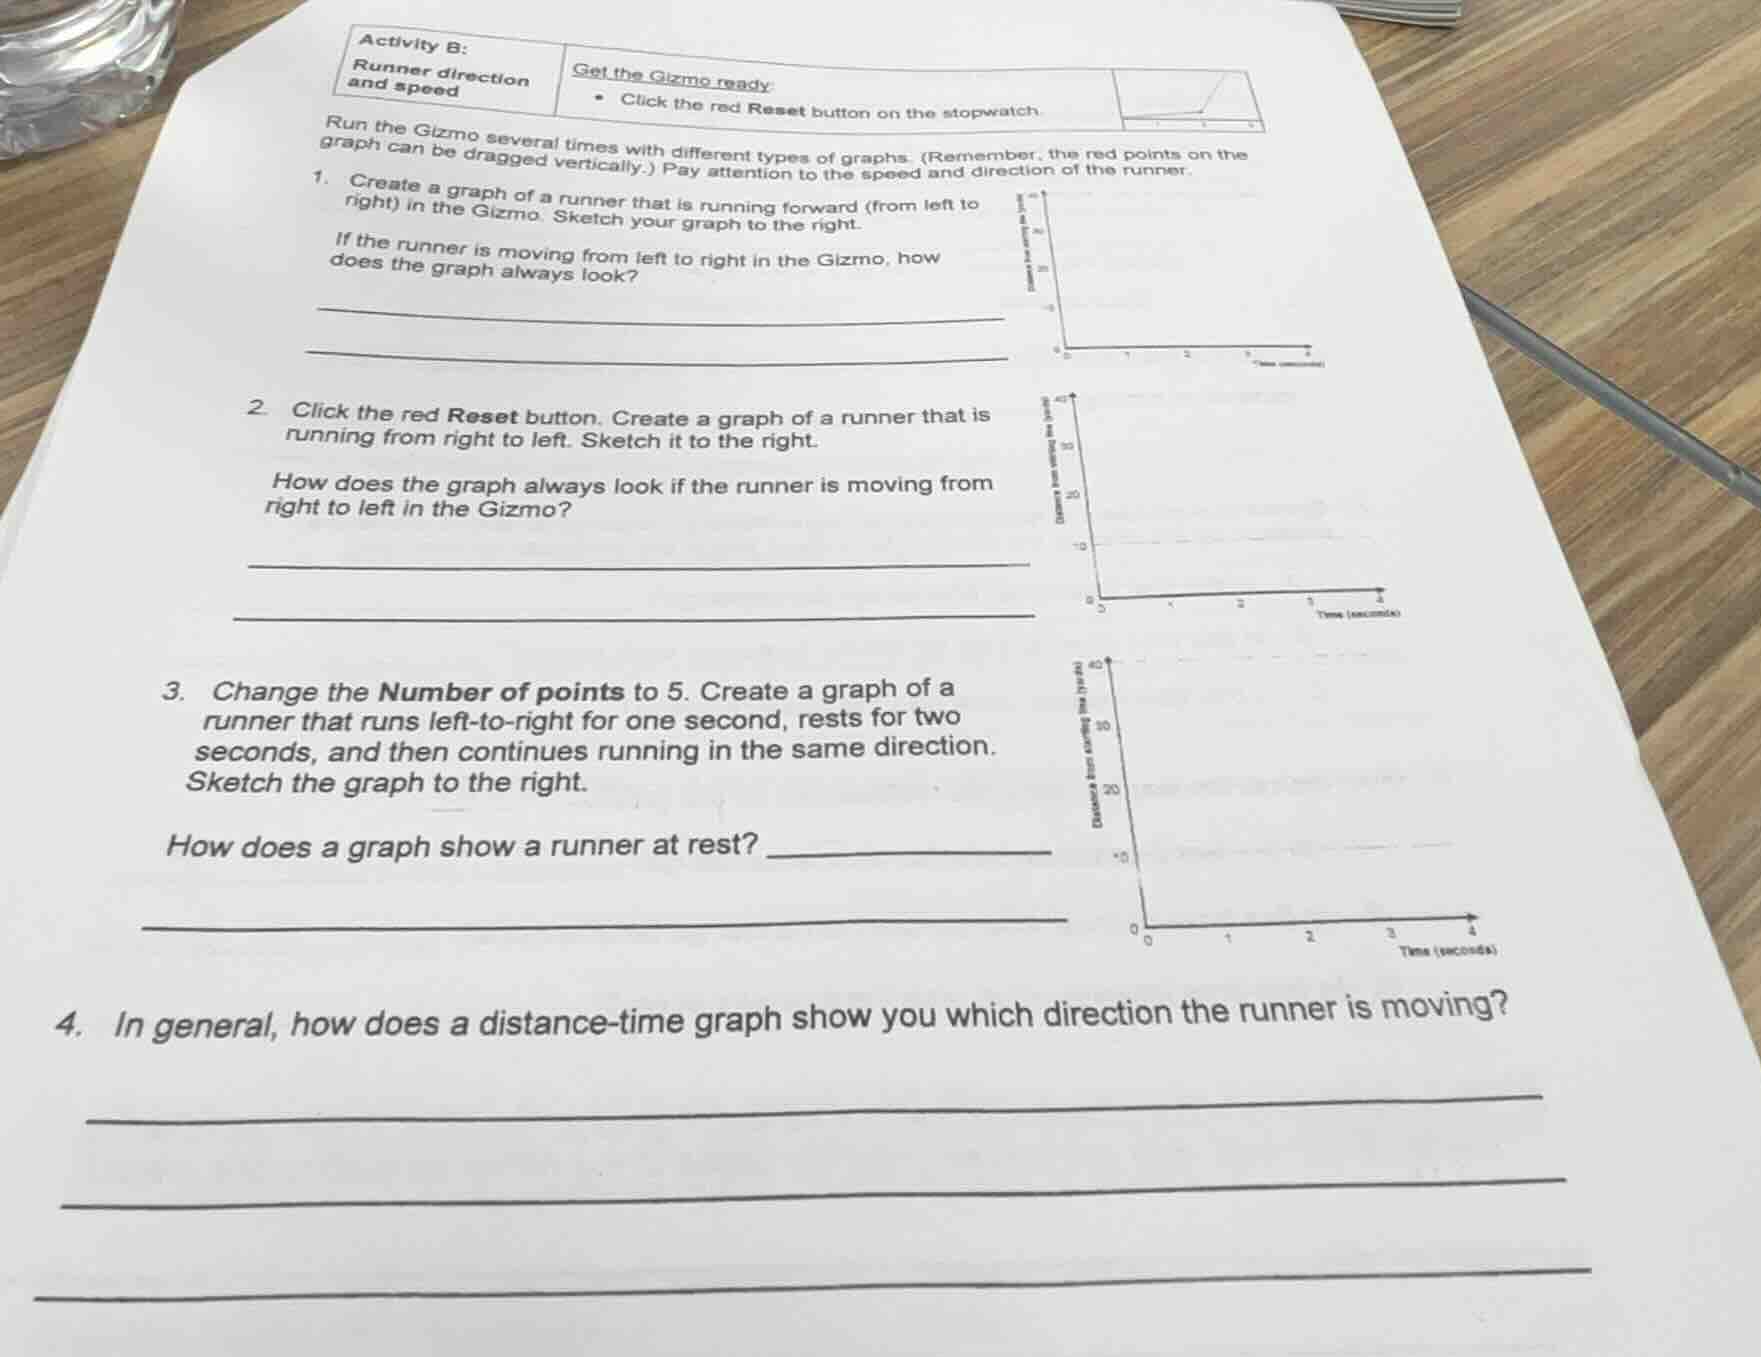
activity b: runner direction and speed get the gizmo ready: - click the red reset button on the stopwatch. run the gizmo several times with different types of graphs. (remember, the red points on the graph can be dragged vertically.) pay attention to the speed and direction of the runner. 1. create a graph of a runner that is running forward (from left to right) in the gizmo. sketch your graph to the right. if the runner is moving from left to right in the gizmo, how does the graph always look? 2. click the red reset button. create a graph of a runner that is running from right to left. sketch it to the right. how does the graph always look if the runner is moving from right to left in the gizmo? 3. change the number of points to 5. create a graph of a runner that runs left - to - right for one second, rests for two seconds, and then continues running in the same direction. sketch the graph to the right. how does a graph show a runner at rest? 4. in general, how does a distance - time graph show you which direction the runner is moving?
1.
When a runner moves left - to - right (forward), the distance from the starting point (or a reference point) increases as time passes. In a distance - time graph, with time on the x - axis and distance on the y - axis, an increasing distance with time means the graph has a positive slope (it goes up from left to right).
When a runner moves right - to - left, the distance from the forward - direction reference point (or the distance we are measuring for the left - to - right direction) decreases as time passes. In a distance - time graph, a decreasing distance with time results in a graph with a negative slope (it goes down from left to right).
When a runner is at rest, the distance from the reference point does not change with time. In a distance - time graph, if the distance remains constant while time is passing, the graph will be a horizontal line segment (parallel to the time (x - ) axis) during the period when the runner is resting.

Snap & solve any problem in the app
Get step-by-step solutions on Sovi AI
Photo-based solutions with guided steps
Explore more problems and detailed explanations
The graph of a runner moving left - to - right (forward) in a distance - time graph is a line (or curve) with a positive slope, meaning the distance value on the y - axis increases as the time value on the x - axis increases.