QUESTION IMAGE
Question
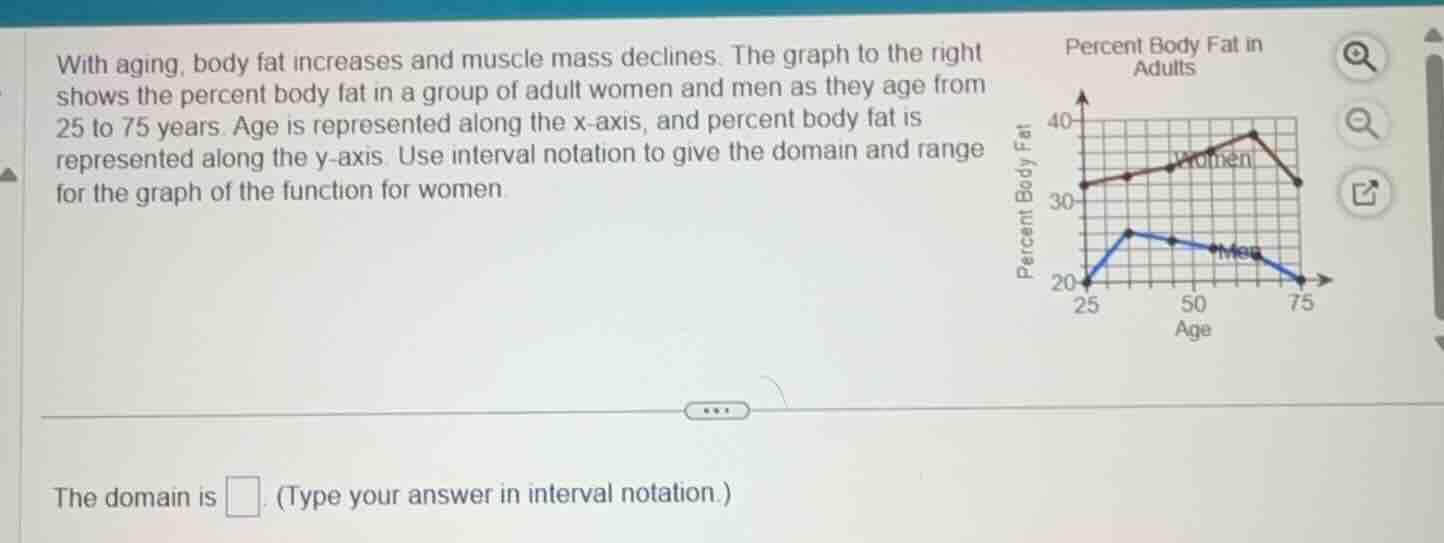
with aging, body fat increases and muscle mass declines. the graph to the right shows the percent body fat in a group of adult women and men as they age from 25 to 75 years. age is represented along the x - axis, and percent body fat is represented along the y - axis. use interval notation to give the domain and range for the graph of the function for women. the domain is (type your answer in interval notation.)
Step1: Identify domain (x-values)
The x-axis (age) ranges from 25 to 75, inclusive.
Domain: $[25, 75]$
Step2: Identify range (y-values)
The y-axis (percent body fat for women) starts at 30 and peaks at 38, inclusive.
Range: $[30, 38]$

Snap & solve any problem in the app
Get step-by-step solutions on Sovi AI
Photo-based solutions with guided steps
Explore more problems and detailed explanations
Domain: $[25, 75]$
Range: $[30, 38]$