QUESTION IMAGE
Question
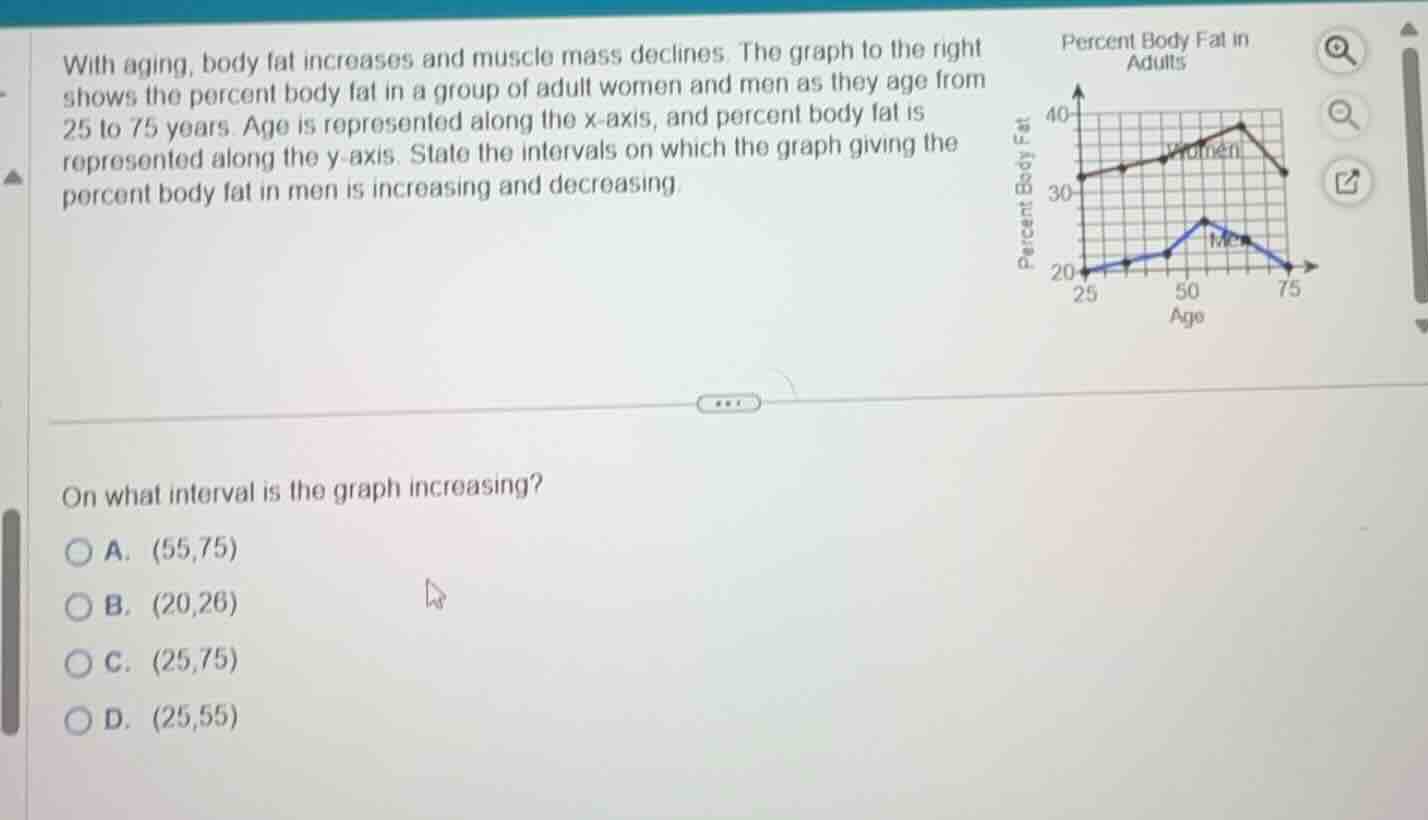
with aging, body fat increases and muscle mass declines. the graph to the right shows the percent body fat in a group of adult women and men as they age from 25 to 75 years. age is represented along the x - axis, and percent body fat is represented along the y - axis. state the intervals on which the graph giving the percent body fat in men is increasing and decreasing. on what interval is the graph increasing? \\(\bigcirc\\) a. \\((55,75)\\) \\(\bigcirc\\) b. \\((20,26)\\) \\(\bigcirc\\) c. \\((25,75)\\) \\(\bigcirc\\) d. \\((25,55)\\)
A graph increases when the y-value (percent body fat) rises as the x-value (age) increases. For men's curve, from age 25 to 55, percent body fat goes up; after 55, it falls. Match this to the options.

Snap & solve any problem in the app
Get step-by-step solutions on Sovi AI
Photo-based solutions with guided steps
Explore more problems and detailed explanations
D. (25,55)