QUESTION IMAGE
Question
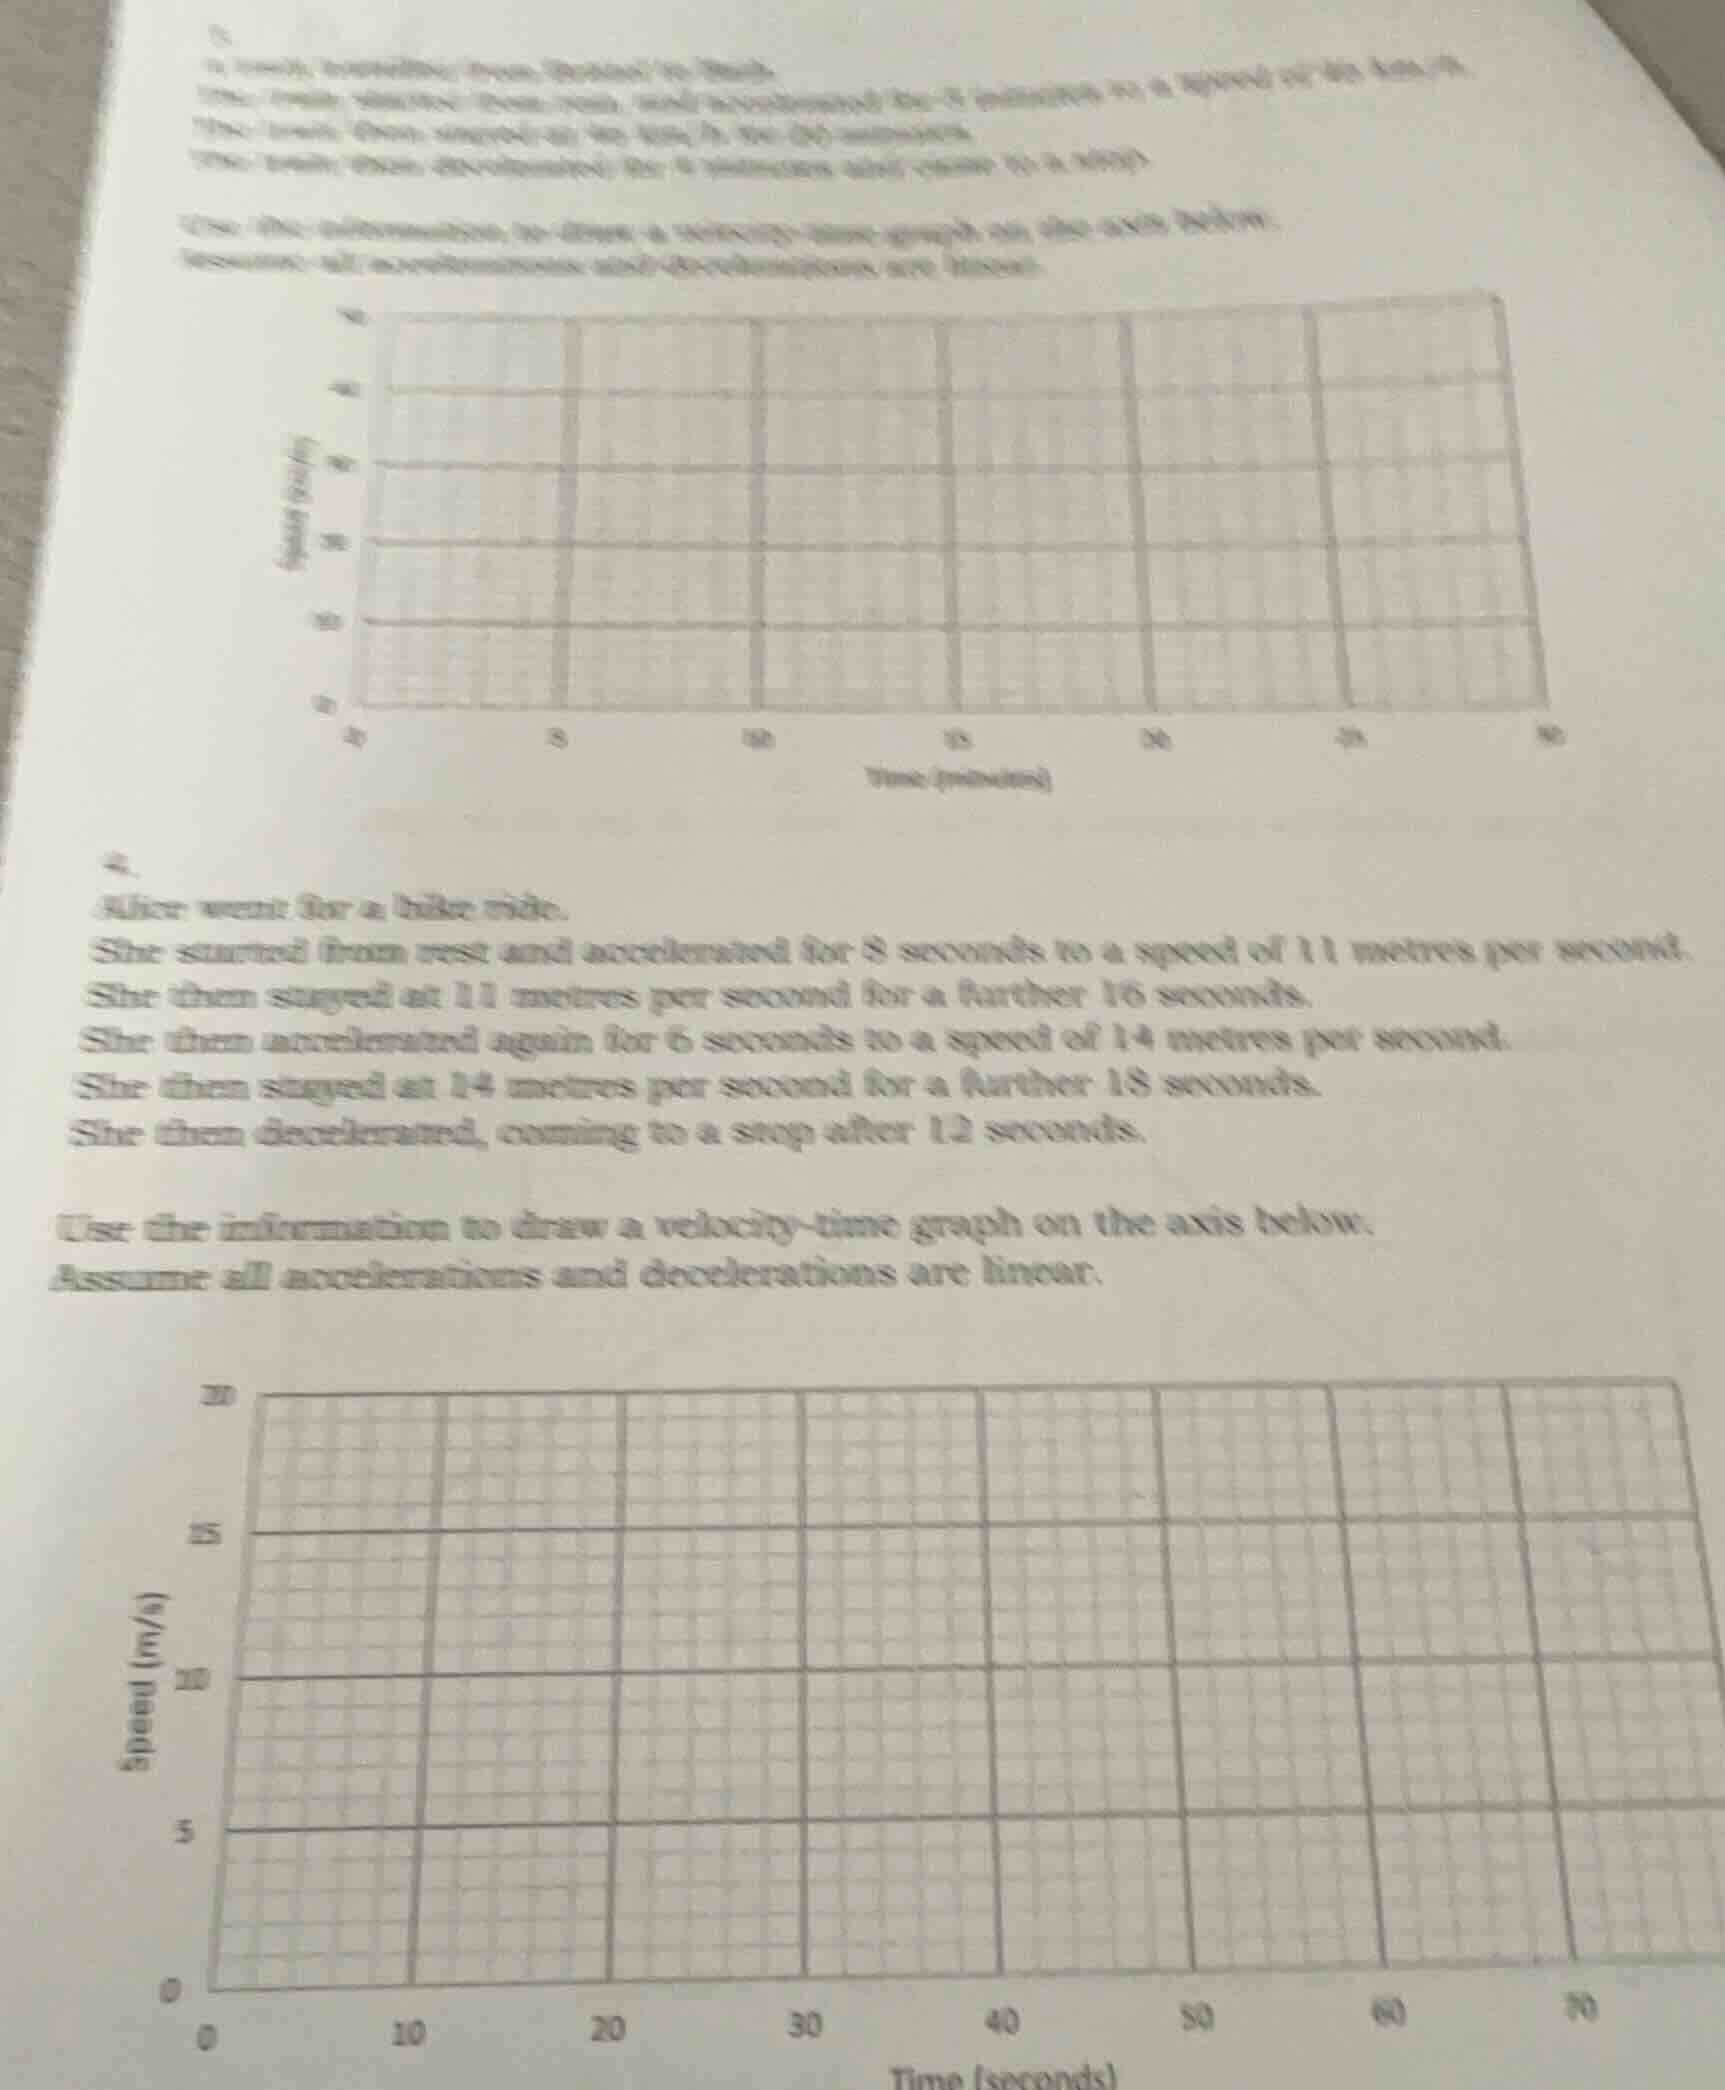
4.
alice went for a bike ride.
she started from rest and accelerated for 8 seconds to a speed of 11 metres per second.
she then stayed at 11 metres per second for a further 16 seconds.
she then accelerated again for 6 seconds to a speed of 14 metres per second.
she then stayed at 14 metres per second for a further 18 seconds.
she then decelerated, coming to a stop after 12 seconds.
use the information to draw a velocity - time graph on the axis below.
assume all accelerations and decelerations are linear.
Step1: Identify time intervals and speeds
- Acceleration 1: Time = 0 - 8 s, Speed goes from 0 to 11 m/s (linear, so a straight line from (0,0) to (8,11)).
- Constant Speed 1: Time = 8 - 8+16 = 24 s, Speed = 11 m/s (horizontal line from (8,11) to (24,11)).
- Acceleration 2: Time = 24 - 24+6 = 30 s, Speed goes from 11 to 14 m/s (linear, straight line from (24,11) to (30,14)).
- Constant Speed 2: Time = 30 - 30+18 = 48 s, Speed = 14 m/s (horizontal line from (30,14) to (48,14)).
- Deceleration: Time = 48 - 48+12 = 60 s, Speed goes from 14 to 0 m/s (linear, straight line from (48,14) to (60,0)).
Step2: Plot the points
- Start at (0, 0).
- Draw a line to (8, 11).
- Draw a horizontal line to (24, 11).
- Draw a line to (30, 14).
- Draw a horizontal line to (48, 14).
- Draw a line to (60, 0).

Snap & solve any problem in the app
Get step-by-step solutions on Sovi AI
Photo-based solutions with guided steps
Explore more problems and detailed explanations
To draw the velocity - time graph:
- Acceleration Phase 1 (0 - 8 s): Plot a line from the origin \((0,0)\) to the point \((8,11)\) since the speed increases linearly from 0 to 11 m/s over 8 seconds.
- Constant Speed Phase 1 (8 - 24 s): Draw a horizontal line from \((8,11)\) to \((24,11)\) as the speed remains constant at 11 m/s for 16 seconds (\(24 - 8=16\)).
- Acceleration Phase 2 (24 - 30 s): Plot a line from \((24,11)\) to \((30,14)\) as the speed increases linearly from 11 to 14 m/s over 6 seconds.
- Constant Speed Phase 2 (30 - 48 s): Draw a horizontal line from \((30,14)\) to \((48,14)\) as the speed remains constant at 14 m/s for 18 seconds (\(48 - 30 = 18\)).
- Deceleration Phase (48 - 60 s): Plot a line from \((48,14)\) to \((60,0)\) as the speed decreases linearly from 14 m/s to 0 over 12 seconds.
The graph will have these segments connecting the respective points on the velocity - time axes (with time on the x - axis in seconds and velocity on the y - axis in m/s).