QUESTION IMAGE
Question
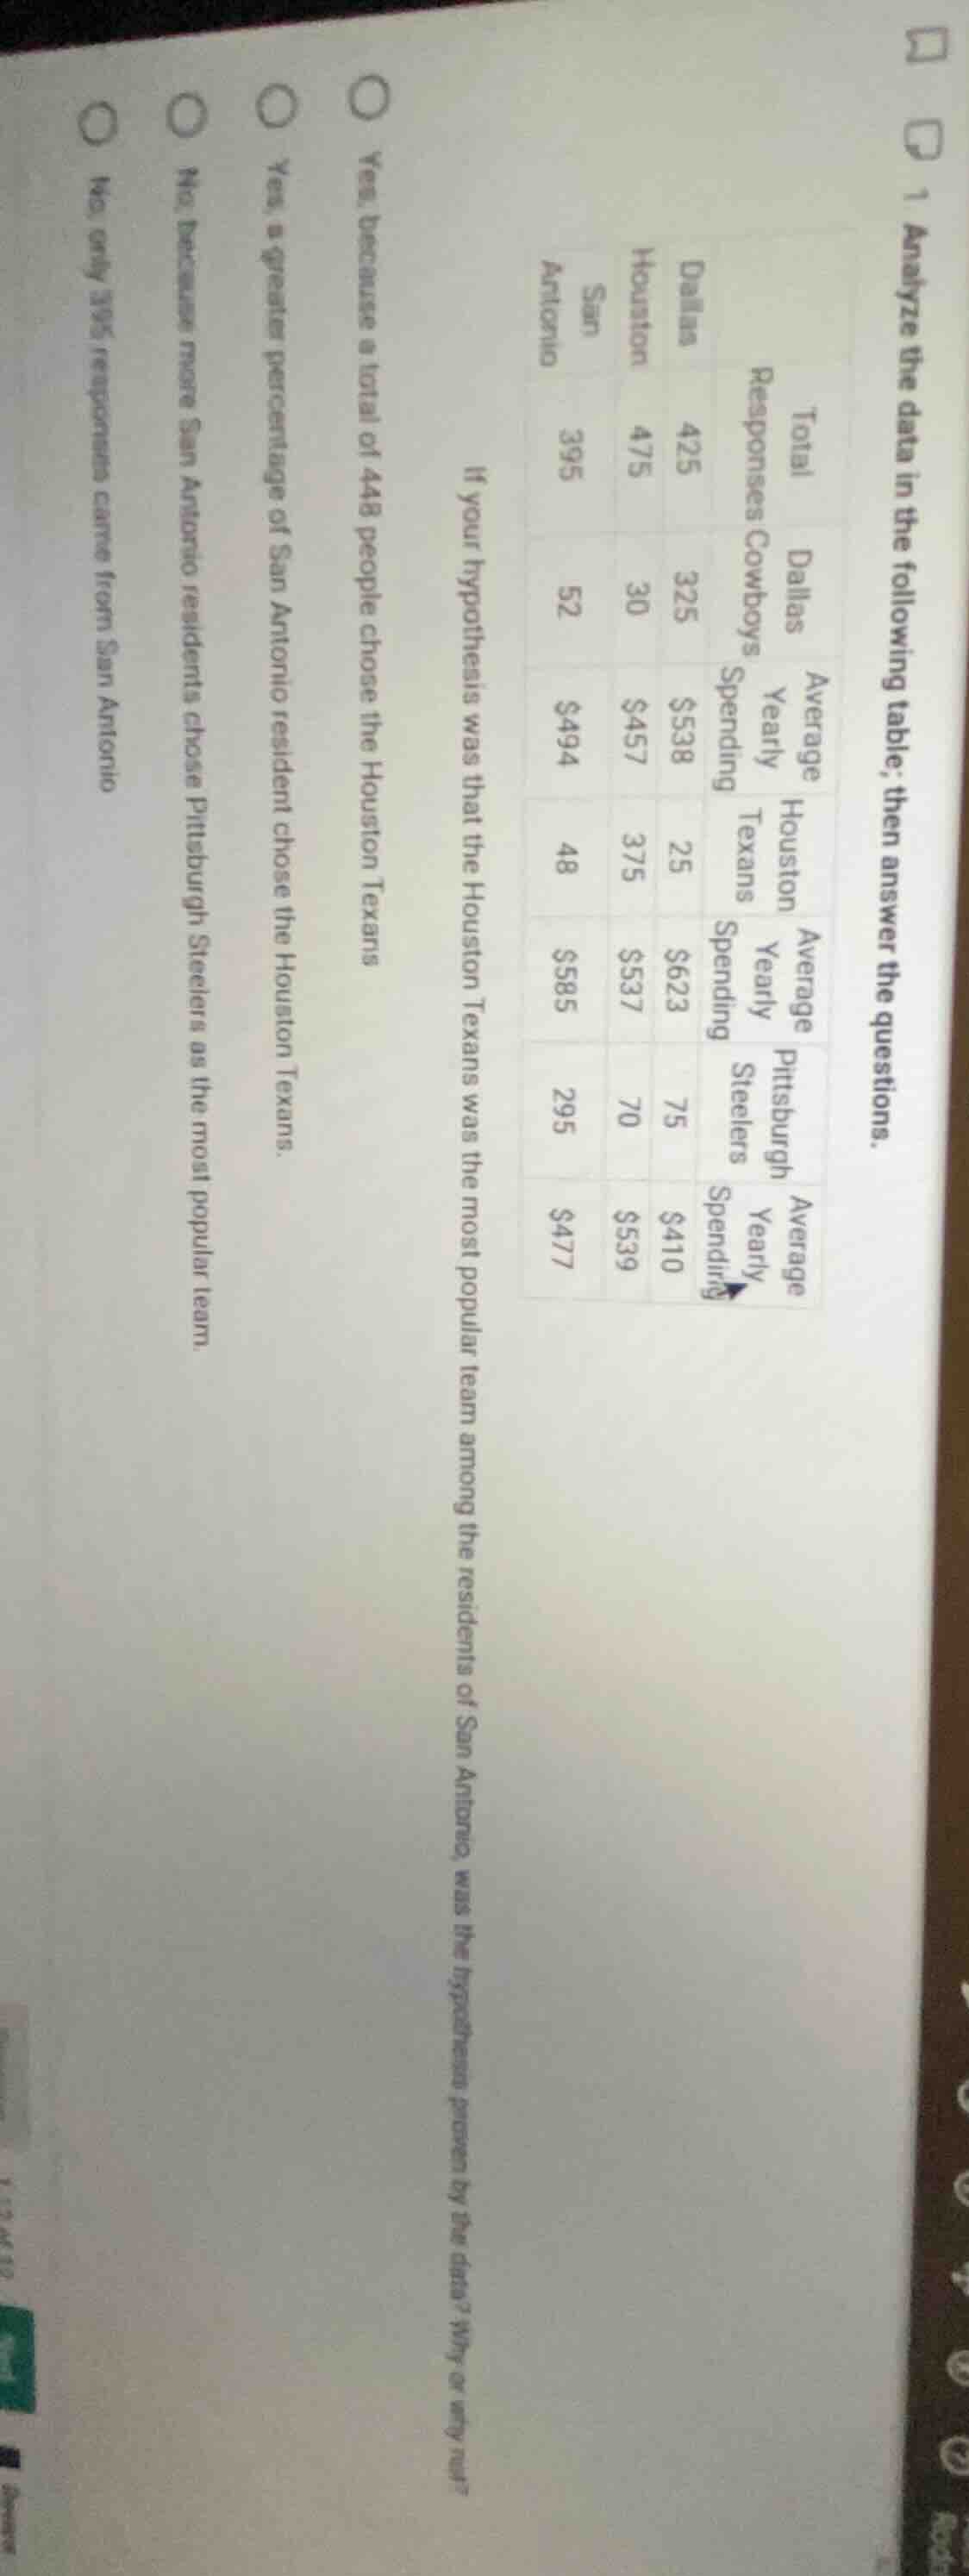
- analyze the data in the following table; then answer the questions.| | dallas | houston | san antonio || ---- | ---- | ---- | ---- || total responses | 425 | 475 | 395 || dallas cowboys average yearly spending | 325, $538 | 30, $457 | 52, $494 || houston texans average yearly spending | 25, $623 | 375, $537 | 48, $585 || pittsburgh steelers average yearly spending | 75, $410 | 70, $539 | 295, $477 |if your hypothesis was that the houston texans was the most popular team among the residents of san antonio, was the hypothesis proven by the data? why or why not?○ yes, because a total of 448 people chose the houston texans○ yes, a greater percentage of san antonio resident chose the houston texans○ no, because more san antonio residents chose pittsburgh steelers as the most popular team○ no, only 395 responses came from san antonio
Step1: Isolate San Antonio data
From the table, San Antonio responses: Total = 395, Cowboys = 52, Texans = 48, Steelers = 295
Step2: Calculate team preference shares
Calculate percentage for each team:
- Cowboys: $\frac{52}{395} \times 100 \approx 13.16\%$
- Texans: $\frac{48}{395} \times 100 \approx 12.15\%$
- Steelers: $\frac{295}{395} \times 100 \approx 74.68\%$
Step3: Compare to hypothesis
Hypothesis claims Texans are most popular in San Antonio, but Steelers have the highest share.

Snap & solve any problem in the app
Get step-by-step solutions on Sovi AI
Photo-based solutions with guided steps
Explore more problems and detailed explanations
No, because more San Antonio residents chose Pittsburgh Steelers as the most popular team.