QUESTION IMAGE
Question
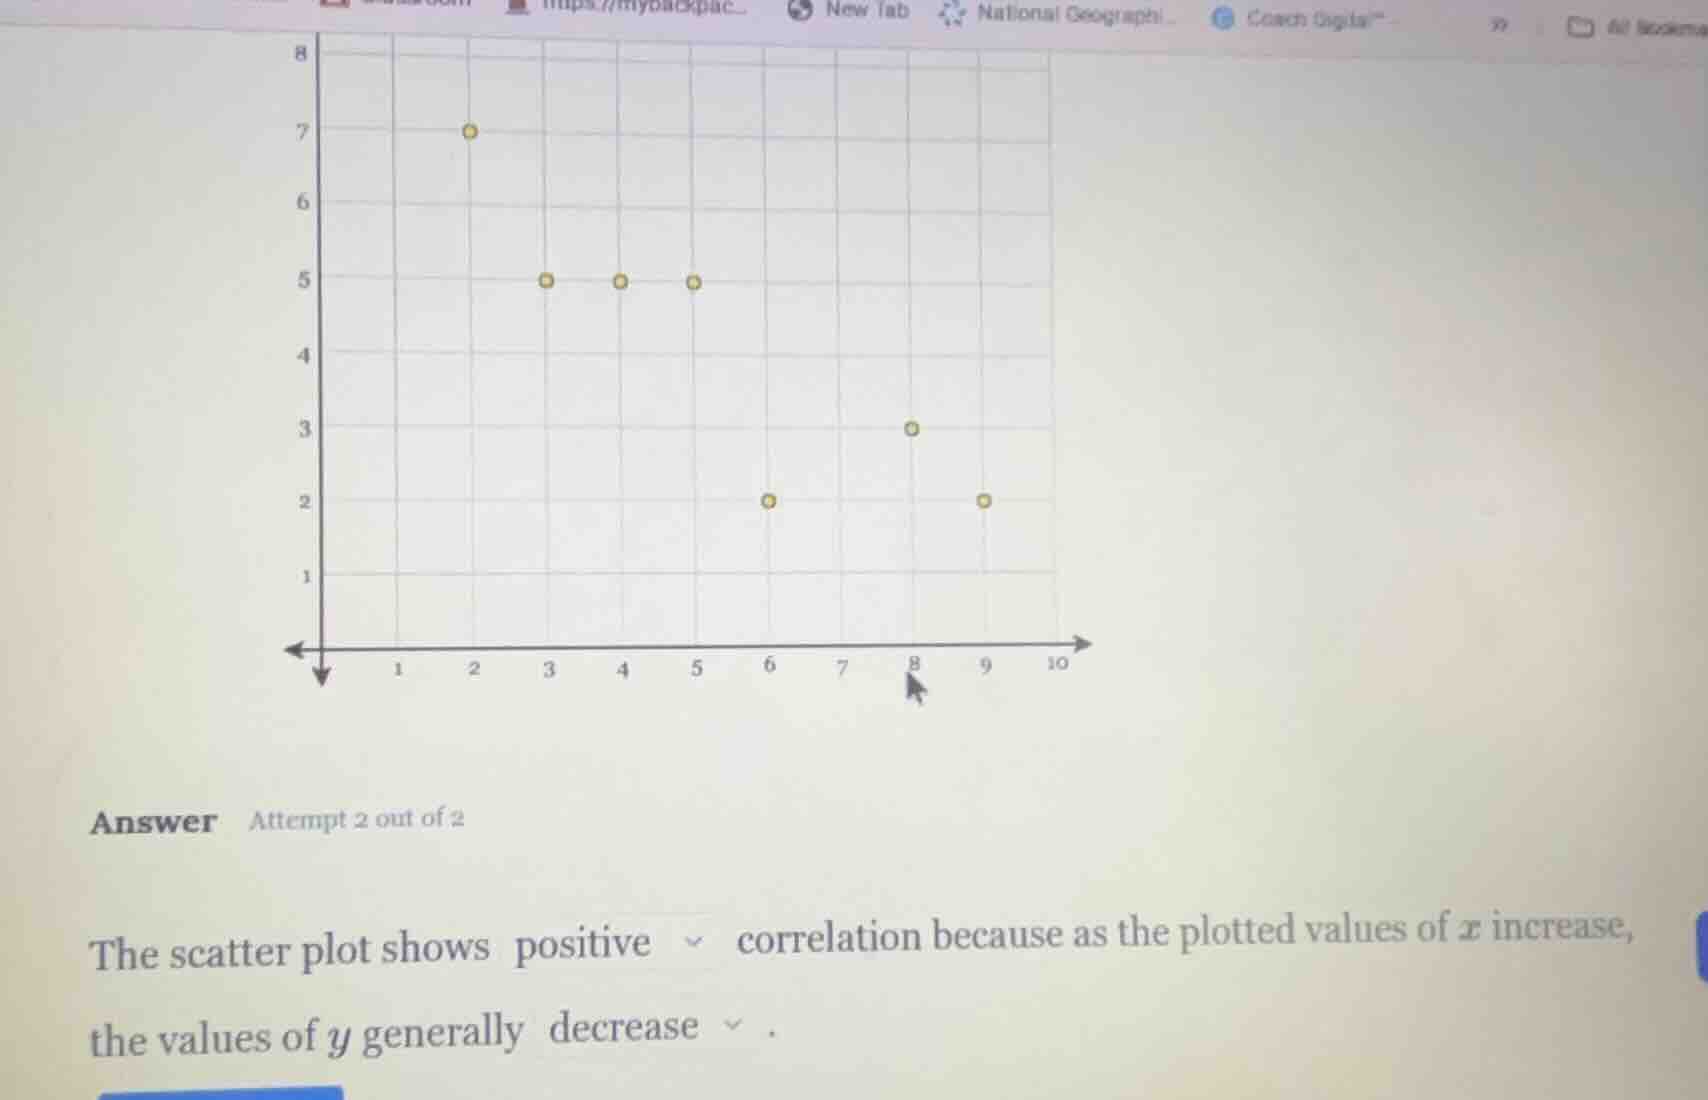
answer attempt 2 out of 2 the scatter plot shows positive correlation because as the plotted values of ( x ) increase, the values of ( y ) generally decrease.
Brief Explanations
A negative correlation exists when an increase in the independent variable ($x$) corresponds to a general decrease in the dependent variable ($y$). Observing the scatter plot, as $x$ values rise from 2 to 9, the $y$ values trend downward overall.

Snap & solve any problem in the app
Get step-by-step solutions on Sovi AI
Photo-based solutions with guided steps
Explore more problems and detailed explanations
The scatter plot shows negative correlation because as the plotted values of $x$ increase, the values of $y$ generally decrease.