QUESTION IMAGE
Question
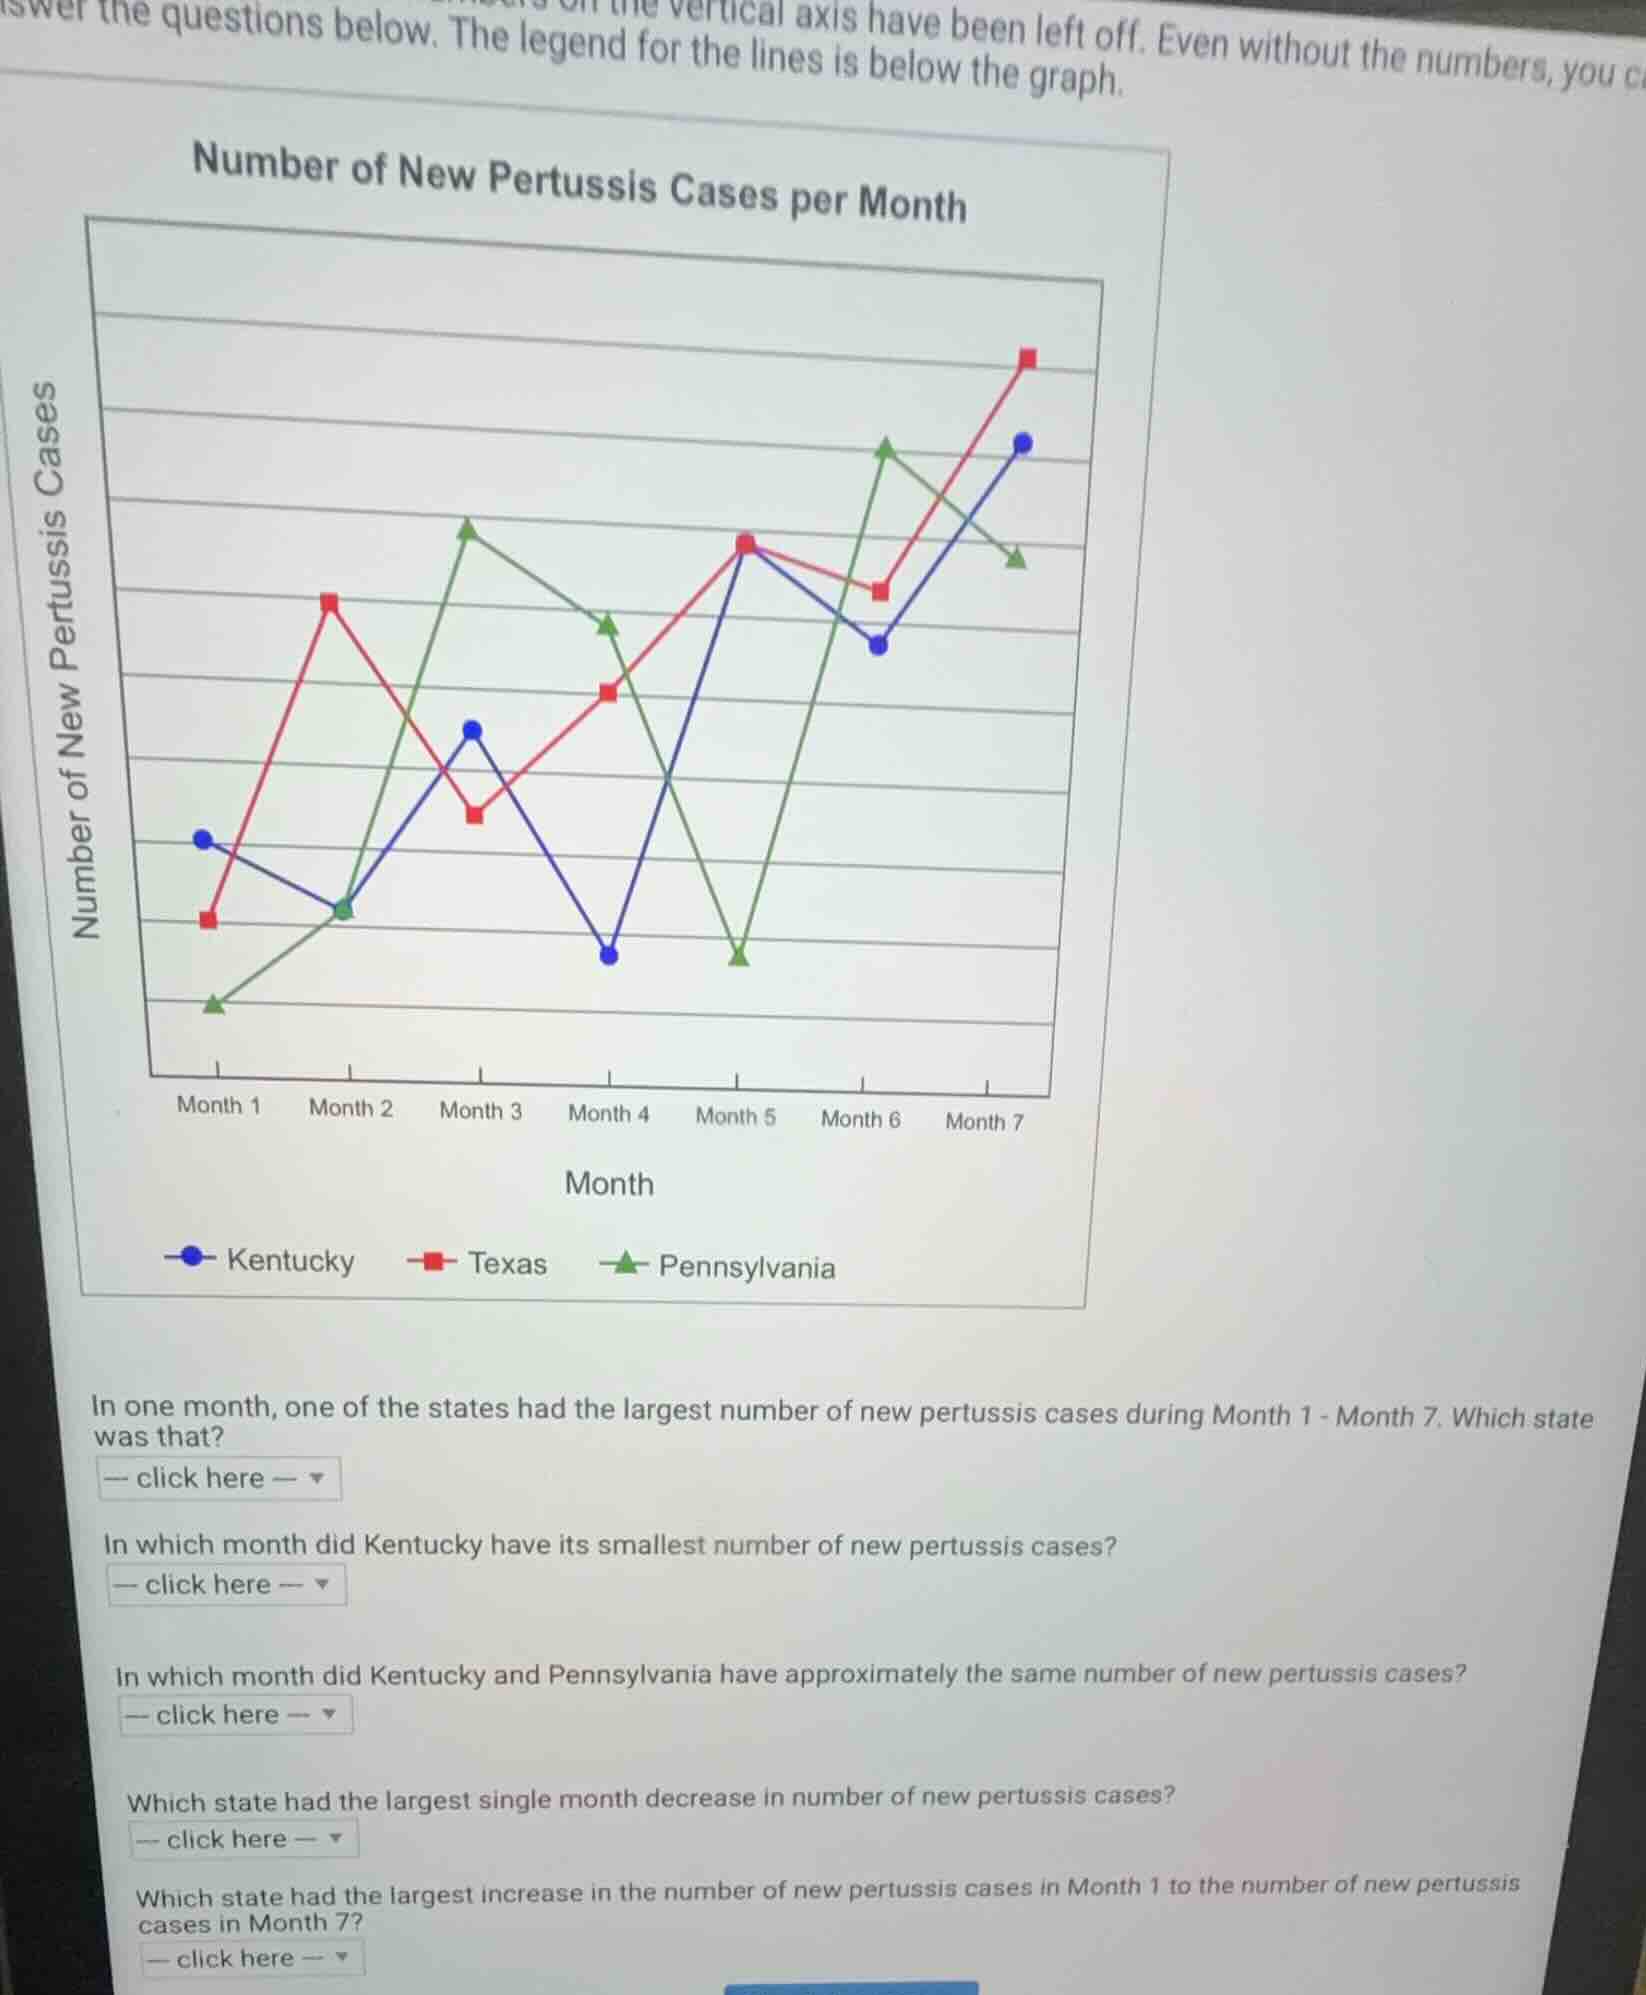
answer the questions below. the legend for the lines is below the graph.
number of new pertussis cases per month
in one month, one of the states had the largest number of new pertussis cases during month 1 - month 7. which state was that?
-- click here --
in which month did kentucky have its smallest number of new pertussis cases?
-- click here --
in which month did kentucky and pennsylvania have approximately the same number of new pertussis cases?
-- click here --
which state had the largest single month decrease in number of new pertussis cases?
-- click here --
which state had the largest increase in the number of new pertussis cases in month 1 to the number of new pertussis cases in month 7?
-- click here --
Step1: Identify peak case state
Observe the highest data point across all months and states. The red line (Texas) has the highest point in Month 7, which is the tallest on the graph.
Step2: Find Kentucky's lowest case month
Locate the lowest data point on the blue line (Kentucky). This occurs at Month 4.
Step3: Match Kentucky-Pennsylvania equal cases
Find the month where the blue (Kentucky) and green (Pennsylvania) lines intersect. This happens at Month 2.
Step4: Identify largest single-month decrease
Calculate the vertical drop between consecutive months for each state:
- Pennsylvania: Month 3 to Month 4 has a large downward shift, larger than drops for Texas and Kentucky.
Step5: Calculate total increase (Month1-Month7)
Compare the difference between Month 7 and Month 1 for each state:
- Texas: Month1 value is low, Month7 is the highest, so the increase is the largest.

Snap & solve any problem in the app
Get step-by-step solutions on Sovi AI
Photo-based solutions with guided steps
Explore more problems and detailed explanations
- Texas
- Month 4
- Month 2
- Pennsylvania
- Texas