QUESTION IMAGE
Question
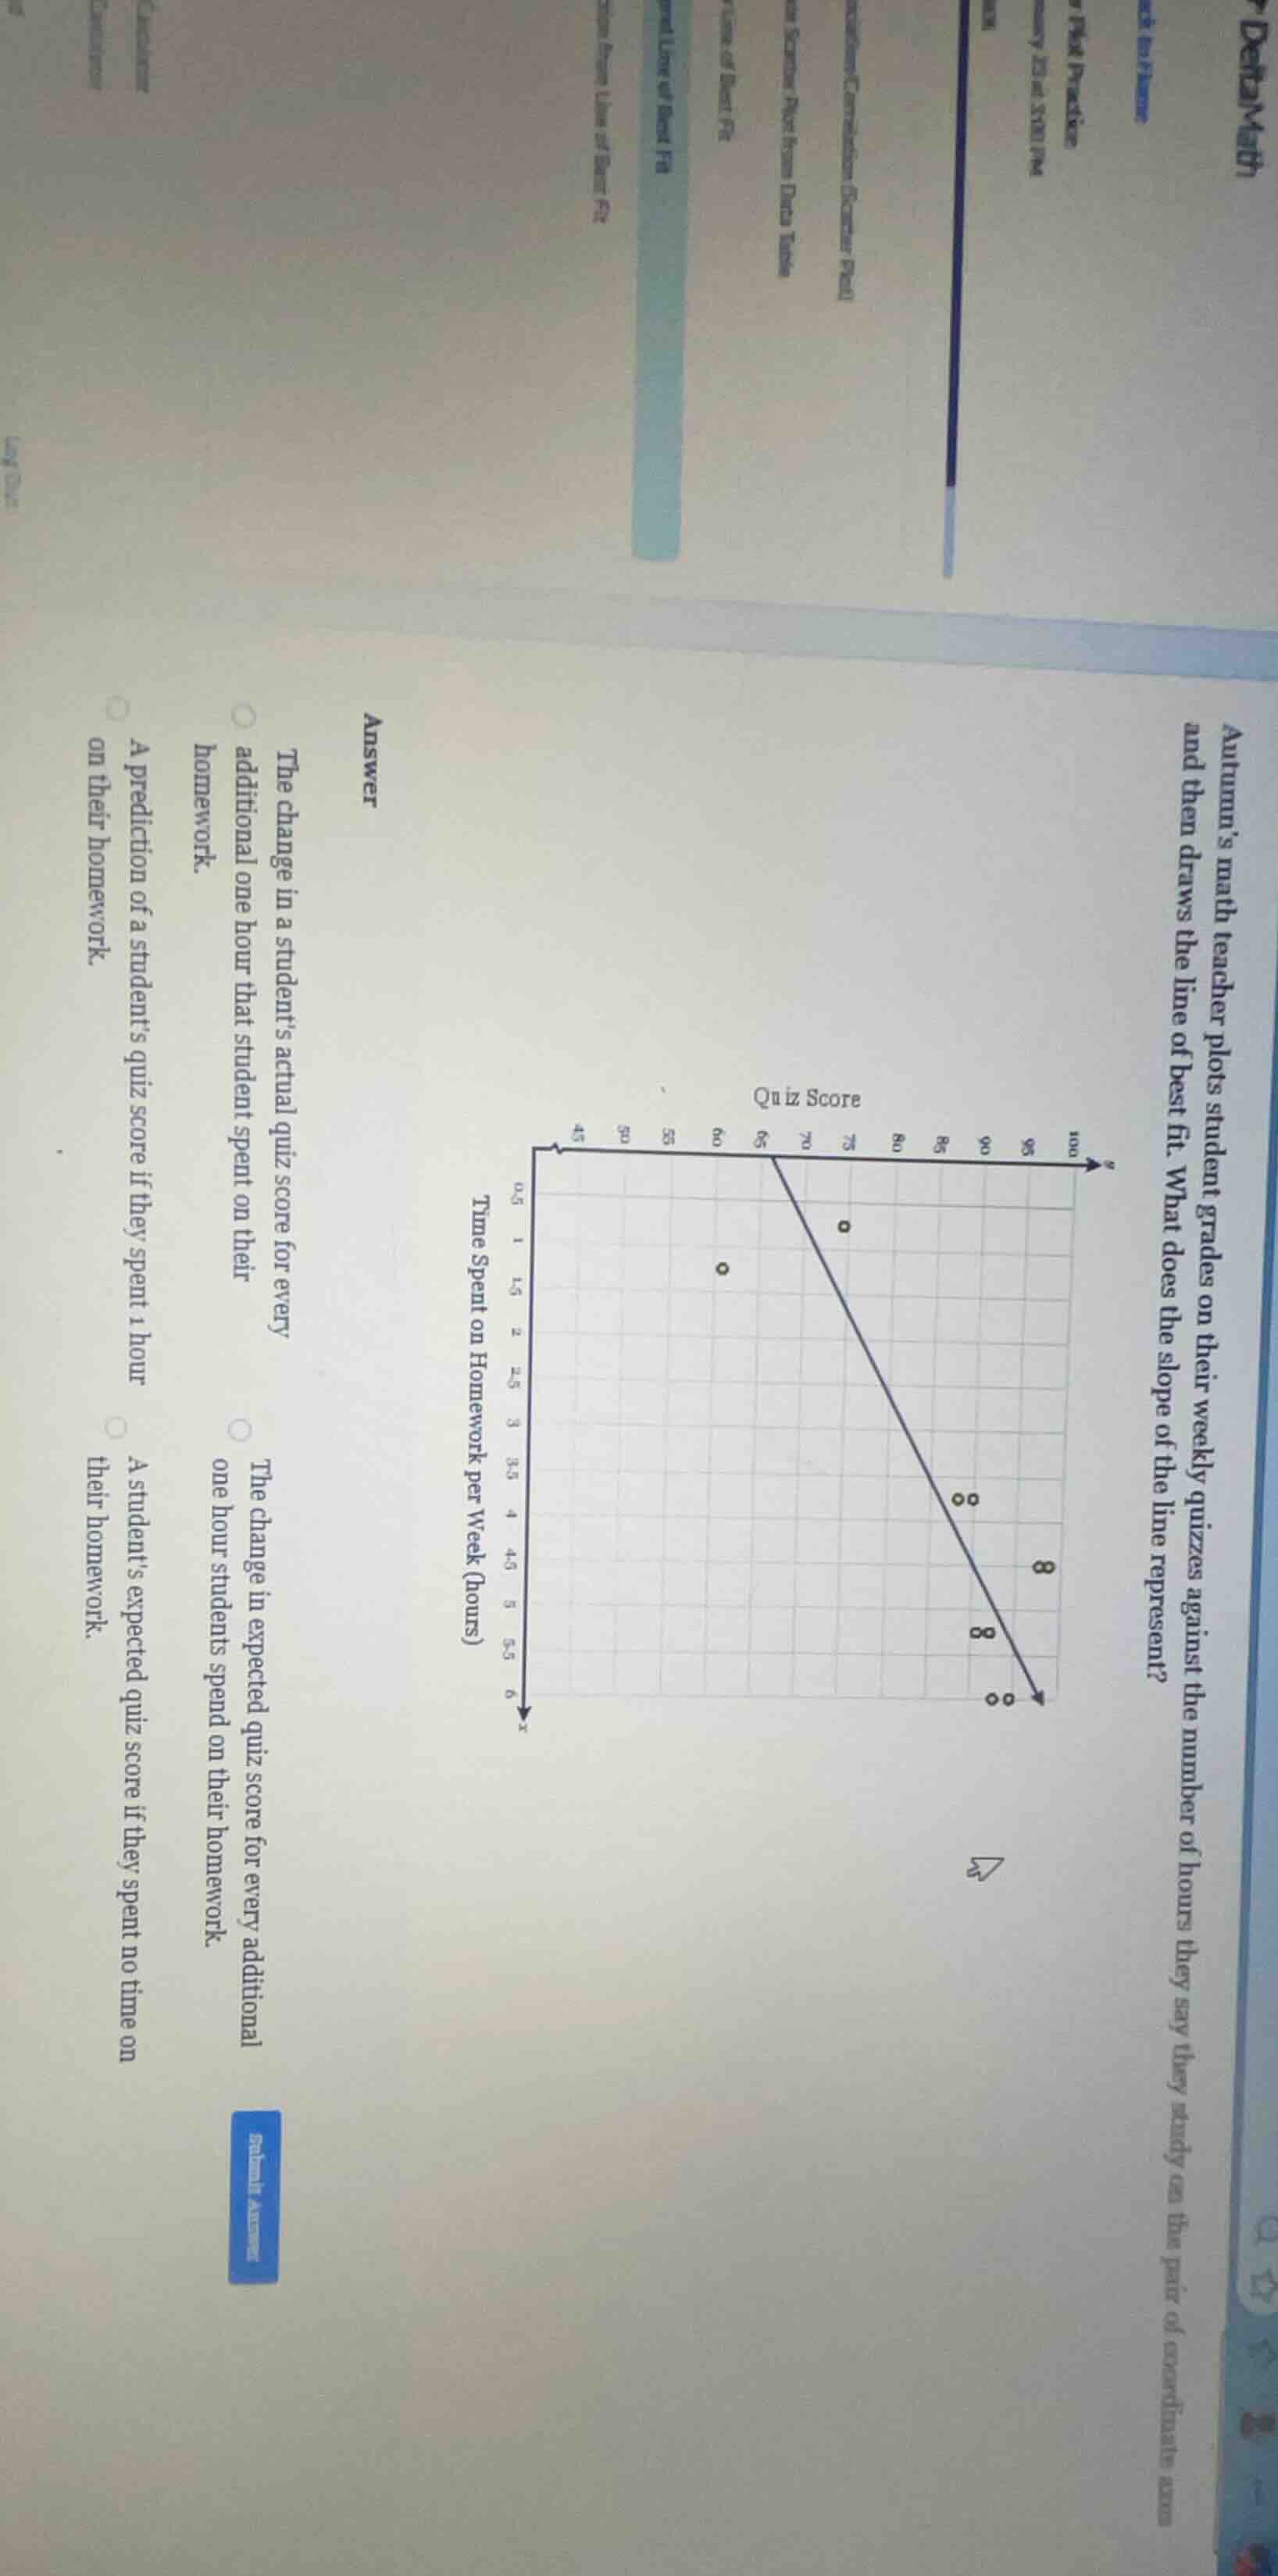
autumns math teacher plots student grades on their weekly quizzes against the number of hours they say they study on the pair of coordinate axes and then draws the line of best fit. what does the slope of the line represent?
answer
the change in a students actual quiz score for every additional one hour that student spent on their homework.
the change in expected quiz score for every additional one hour students spend on their homework.
a prediction of a students quiz score if they spent 1 hour on their homework.
a students expected quiz score if they spent no time on their homework.
The line of best fit is a predictive model, not a measure of actual individual data points. Its slope represents the expected change in the dependent variable (quiz score) for each 1-unit increase in the independent variable (time spent on homework). The other options are incorrect because: the slope does not describe actual score changes, predictions for a specific 1-hour value, or the score when no time is spent (that is the y-intercept).

Snap & solve any problem in the app
Get step-by-step solutions on Sovi AI
Photo-based solutions with guided steps
Explore more problems and detailed explanations
The change in expected quiz score for every additional one hour students spend on their homework.