QUESTION IMAGE
Question
az-common core algebra i b-cr
mon core algebra i b-cr english
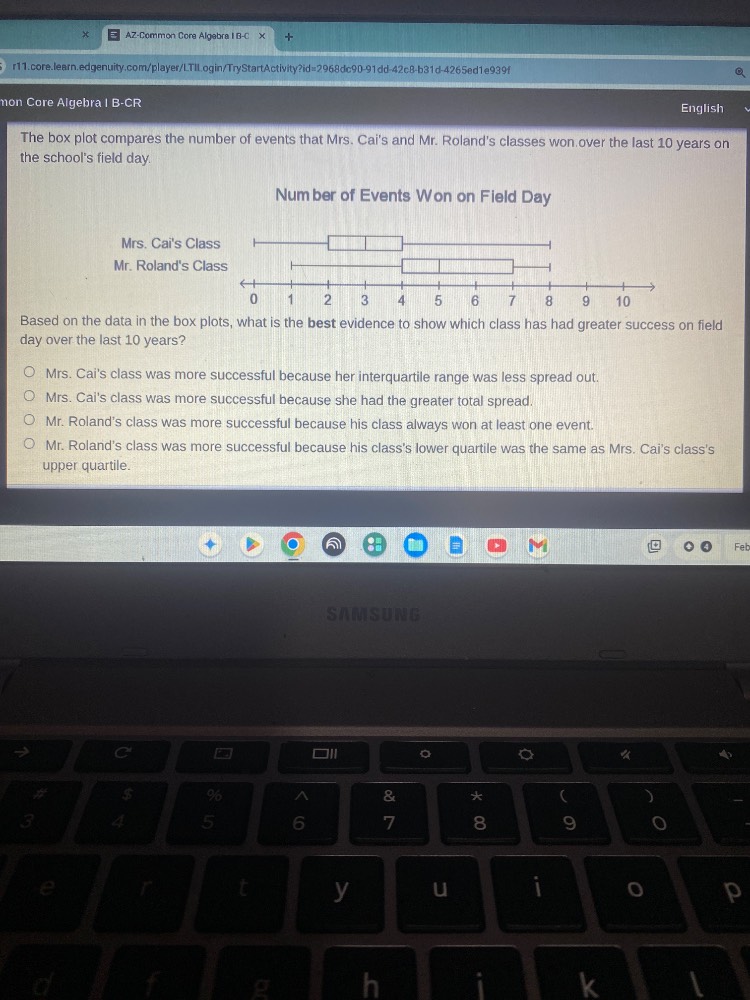
the box plot compares the number of events that mrs. cais and mr. rolands classes won over the last 10 years on the schools field day.
number of events won on field day
mrs. cais class
mr. rolands class
0 1 2 3 4 5 6 7 8 9 10
based on the data in the box plots, what is the best evidence to show which class has had greater success on field day over the last 10 years?
mrs. cais class was more successful because her interquartile range was less spread out.
mrs. cais class was more successful because she had the greater total spread.
mr. rolands class was more successful because his class always won at least one event.
mr. rolands class was more successful because his classs lower quartile was the same as mrs. cais classs upper quartile.
First, analyze the box plots:
- Mrs. Cai's class: min=0, Q1=2, Q3=4, max=9
- Mr. Roland's class: min=1, Q1=4, Q3=7, max=8
Now evaluate each option:
- Option 1: A smaller IQR means less spread, but not greater success. Cai's IQR = 4-2=2, Roland's IQR=7-4=3; this does not show success.
- Option 2: Greater total spread (range) does not equal success. Cai's range=9-0=9, Roland's=8-1=7; this is irrelevant to success.
- Option 3: "Always won at least one event" is a minimum value, not a measure of overall greater success.
- Option 4: Roland's lower quartile (Q1=4) equals Cai's upper quartile (Q3=4). This means 75% of Roland's data is ≥4, while only 25% of Cai's data is ≥4, showing Roland's class had consistently higher wins.

Snap & solve any problem in the app
Get step-by-step solutions on Sovi AI
Photo-based solutions with guided steps
Explore more problems and detailed explanations
Mr. Roland's class was more successful because his class's lower quartile was the same as Mrs. Cai's class's upper quartile.