QUESTION IMAGE
Question
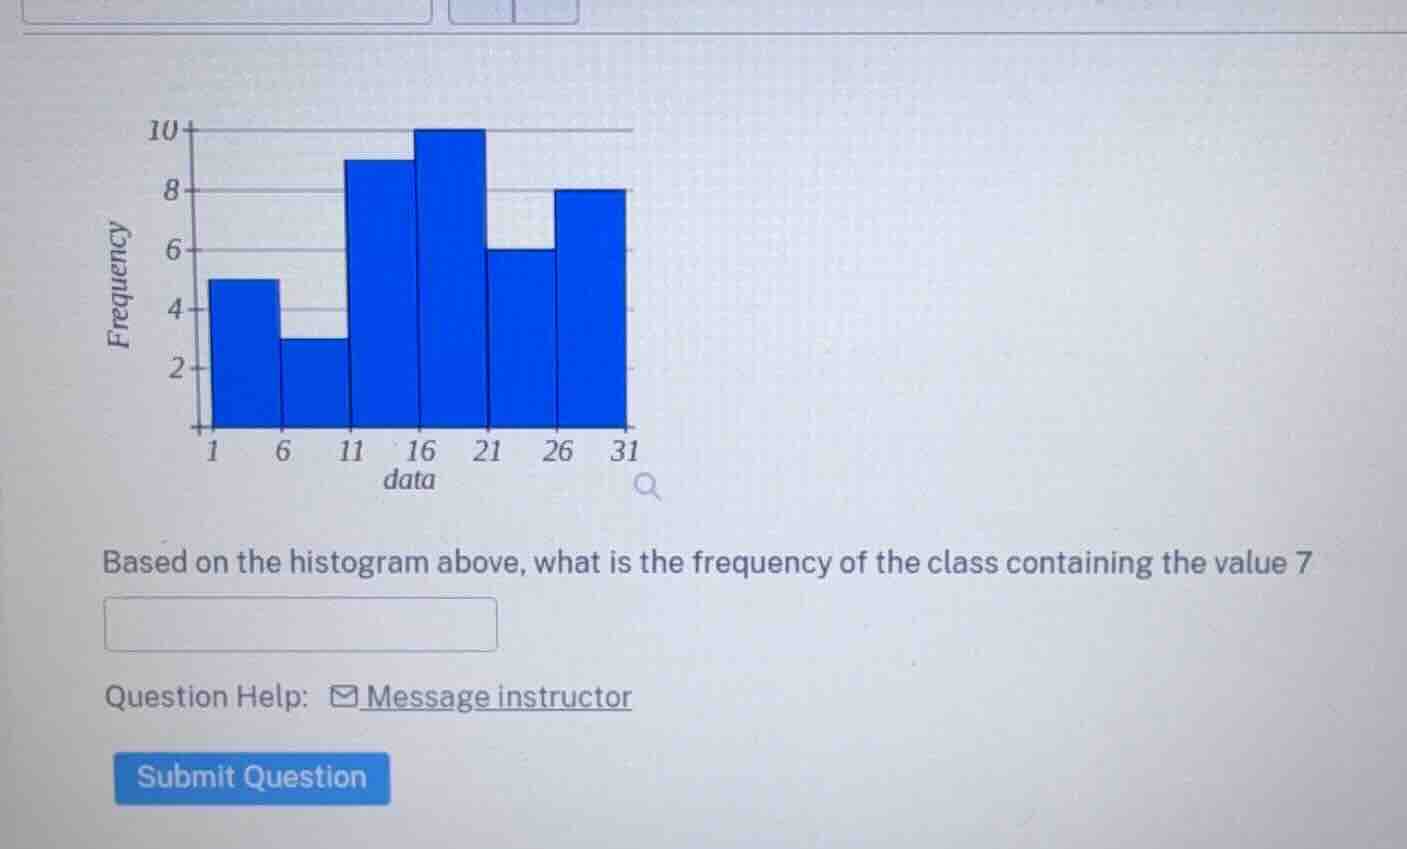
based on the histogram above, what is the frequency of the class containing the value 7
Step1: Identify the class for 7
The histogram has classes: 1 - 5, 6 - 10, 11 - 15, 16 - 20, 21 - 25, 26 - 30 (approx). The value 7 is in 6 - 10.
Step2: Find frequency of 6 - 10 class
The bar for 6 - 10 (x - axis around 6) has frequency 3 (from the graph: the second bar, y - axis ~3). Wait, re - check: the x - axis labels are 1, 6, 11, 16, 21, 26, 31. So the class between 1 - 6? No, wait, the first bar is 1 - 5 (x = 1), second is 6 - 10 (x = 6), third 11 - 15 (x = 11), etc. The second bar (x = 6) has frequency 3 (looking at y - axis: 2, 3? Wait, the y - axis is frequency. The second bar (at x = 6) has height 3? Wait, no, the first bar (x = 1) is 5, second (x = 6) is 3? Wait, no, the graph: first bar (1) has frequency 5, second (6) has 3? Wait, no, the y - axis is 2,4,6,8,10. Wait, the second bar (x = 6) is at y = 3? No, maybe I misread. Wait, the x - axis labels are 1,6,11,16,21,26,31. So the class intervals are: 1 - 5 (x = 1), 6 - 10 (x = 6), 11 - 15 (x = 11), 16 - 20 (x = 16), 21 - 25 (x = 21), 26 - 30 (x = 26), 31 - 35? No, the last bar is at 31. Wait, the second bar (x = 6) has frequency 3? Wait, no, looking at the graph: the first bar (x = 1) is up to y = 5, second (x = 6) is up to y = 3? Wait, no, the y - axis is 2,4,6,8,10. The second bar (at x = 6) has height 3? Wait, no, maybe I made a mistake. Wait, the x - axis points are 1,6,11,16,21,26,31. So the class width is 5 (6 - 1 = 5, 11 - 6 = 5, etc.). So the class for 6 - 10 (since 6 to 11 - 1 = 10) is the second bar. The second bar (x = 6) has a frequency of 3? Wait, no, looking at the graph, the second bar (the one with x = 6) has a height of 3? Wait, no, the y - axis: the first bar (x = 1) is 5, second (x = 6) is 3, third (x = 11) is 9, fourth (x = 16) is 10, fifth (x = 21) is 6, sixth (x = 26) is 8? No, re - examining: the y - axis is frequency, with marks at 2,4,6,8,10. The first bar (leftmost) reaches up to 5 (between 4 and 6), the second bar (next) reaches up to 3 (between 2 and 4), the third bar reaches up to 9 (between 8 and 10), the fourth up to 10, the fifth up to 6, the sixth up to 8. Wait, the value 7 is in the class corresponding to the second bar (since 6 ≤ 7 < 11? Wait, the x - axis labels are 1,6,11,16,21,26,31. So the class intervals are [1,6), [6,11), [11,16), [16,21), [21,26), [26,31). So 7 is in [6,11). The bar for [6,11) is the second bar, and its frequency (height) is 3? Wait, no, the y - axis: the second bar's height is 3? Wait, the first bar ( [1,6) ) has height 5, second ( [6,11) ) has height 3, third ( [11,16) ) has height 9, fourth ( [16,21) ) has height 10, fifth ( [21,26) ) has height 6, sixth ( [26,31) ) has height 8. So the frequency for the class containing 7 (which is [6,11)) is 3? Wait, no, maybe I misread the y - axis. Wait, the y - axis is frequency, with 2,4,6,8,10. The second bar (at x = 6) is at y = 3? Wait, no, the first bar is at y = 5 (between 4 and 6), second at y = 3 (between 2 and 4), yes. So the frequency is 3? Wait, no, maybe the class is 6 - 10, and the bar for 6 - 10 has frequency 3. Wait, but let's check again. The x - axis labels are 1,6,11,16,21,26,31. So the class width is 5 (6 - 1 = 5, 11 - 6 = 5, etc.). So the first class is 1 - 5 (inclusive? Or exclusive?), but the value 7 is in the class starting at 6, so the second bar. The height of the second bar is 3 (from the graph: the second bar is shorter, y - axis ~3). So the frequency is 3. Wait, no, maybe I made a mistake. Wait, the user's graph: first bar (x = 1) frequency 5, second (x = 6) frequency 3, third (x = 11) frequency 9, fourth (x = 16) frequency 10, fifth (x =…

Snap & solve any problem in the app
Get step-by-step solutions on Sovi AI
Photo-based solutions with guided steps
Explore more problems and detailed explanations
3