QUESTION IMAGE
Question
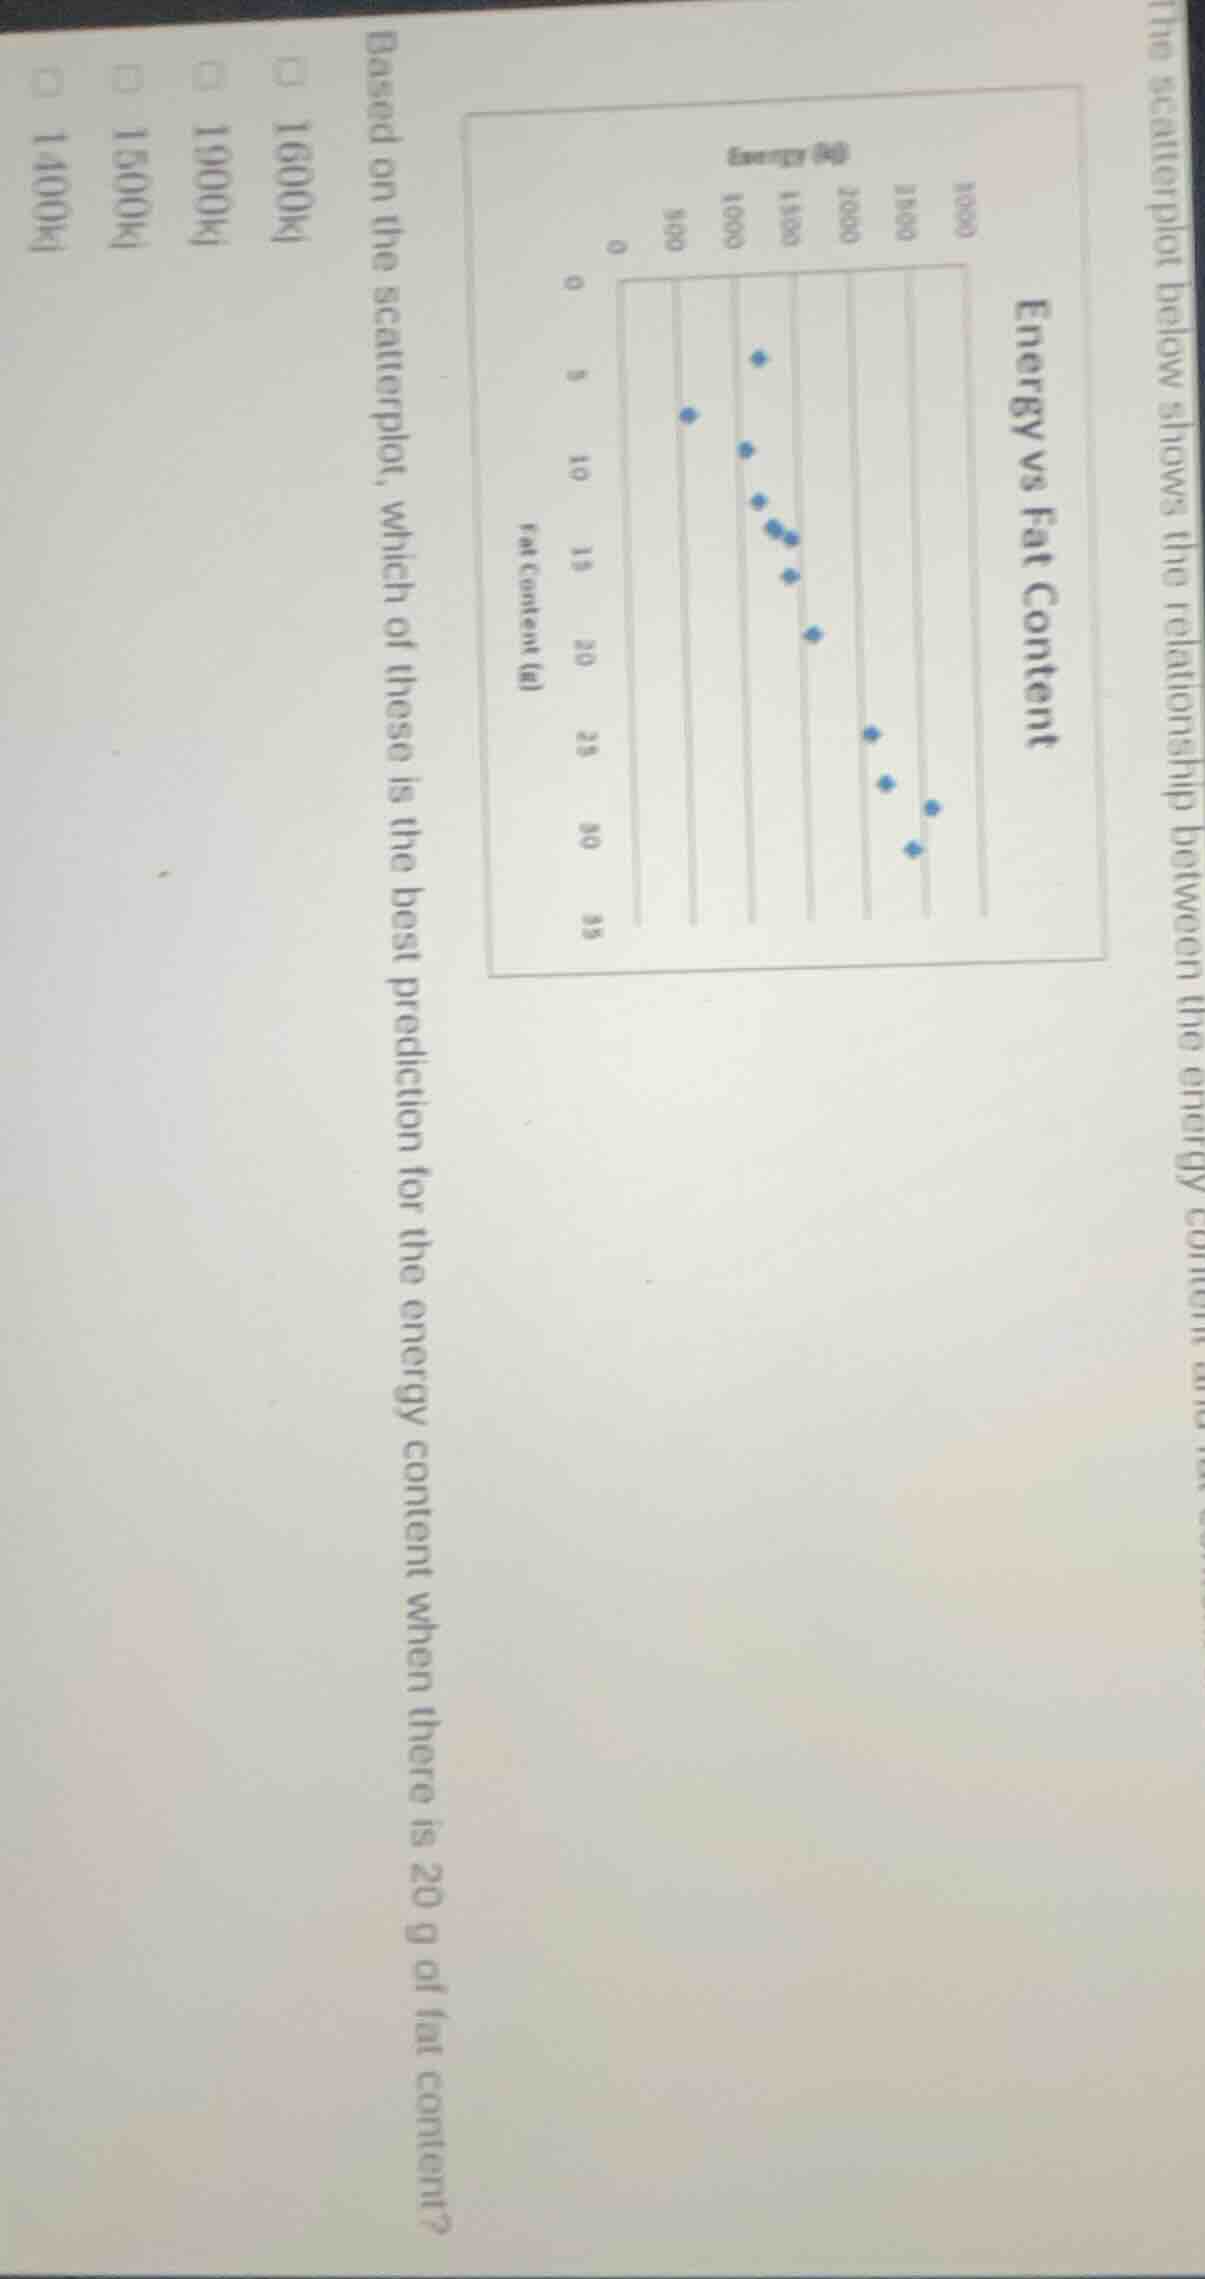
based on the scatterplot, which of these is the best prediction for the energy content when there is 20 g of fat content? 1600kj 1900kj 1500kj 1400kj
Step1: Analyze the scatterplot trend
The scatterplot shows a positive correlation between fat content (x - axis) and energy (y - axis). As fat content increases, energy content generally increases.
Step2: Locate fat content = 20g
Find the position on the x - axis (fat content) corresponding to 20g. Then, look at the trend of the data points. The data points seem to follow a pattern where at around 20g of fat, the energy content should be around 1500kJ (by observing the general trend of the scatterplot: as fat increases from lower values to 20g, the energy increases, and the option 1500kJ fits the trend better than 1400kJ, 1600kJ, or 1900kJ which are either too low or too high compared to the trend).

Snap & solve any problem in the app
Get step-by-step solutions on Sovi AI
Photo-based solutions with guided steps
Explore more problems and detailed explanations
1500kJ