QUESTION IMAGE
Question
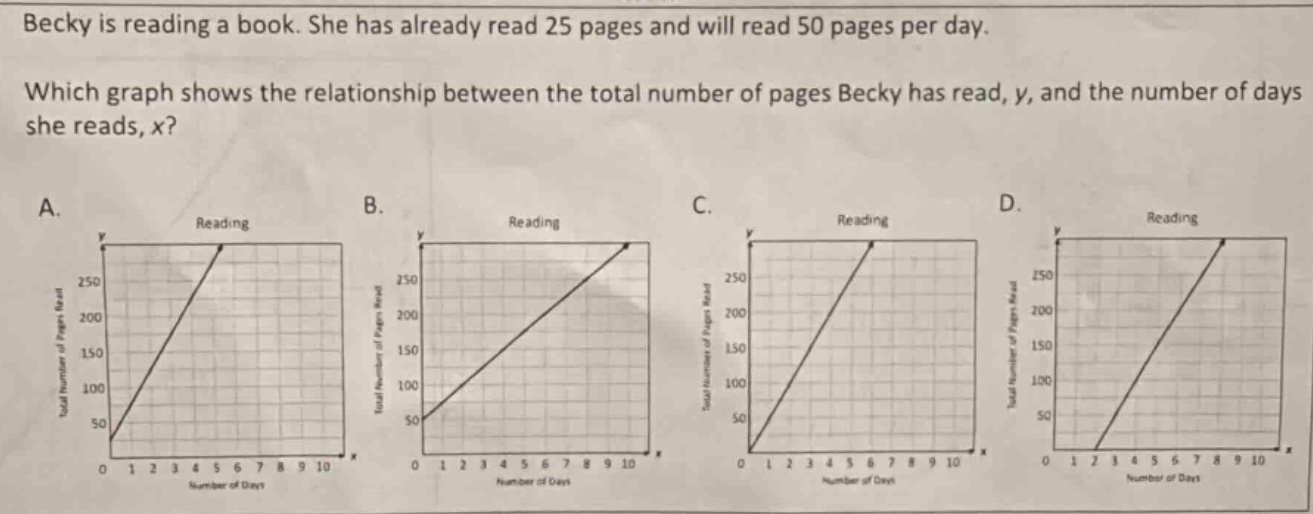
becky is reading a book. she has already read 25 pages and will read 50 pages per day. which graph shows the relationship between the total number of pages becky has read, y, and the number of days she reads, x? a. graph a b. graph b c. graph c d. graph d
Step1: Determine the equation
The total pages \( y \) Becky reads is the initial pages (25) plus the pages read per day (50) times the number of days \( x \). So the equation is \( y = 50x + 25 \).
Step2: Analyze the y-intercept
For a linear equation \( y = mx + b \), the y-intercept is \( b \). Here, \( b = 25 \), so when \( x = 0 \) (0 days), \( y = 25 \). This means the graph should start at \( (0, 25) \).
Step3: Analyze the slope
The slope \( m = 50 \), meaning for each day (\( x \) increases by 1), \( y \) increases by 50.
Now, check the graphs:
- Graph A: Starts at (0,0) – incorrect, since y-intercept should be 25.
- Graph B: Starts at (0,25) – matches the y-intercept. The slope also shows an increase of 50 per day (e.g., from x=0, y=25; x=1, y=75; x=2, y=125, etc., which is 50 per day).
- Graph C: Starts at (0,0) – incorrect.
- Graph D: Starts at (x=2, y=0) – incorrect.

Snap & solve any problem in the app
Get step-by-step solutions on Sovi AI
Photo-based solutions with guided steps
Explore more problems and detailed explanations
B. The graph with y - intercept at 25 (when x = 0, y = 25) and a slope of 50 (increasing 50 pages per day)