QUESTION IMAGE
Question
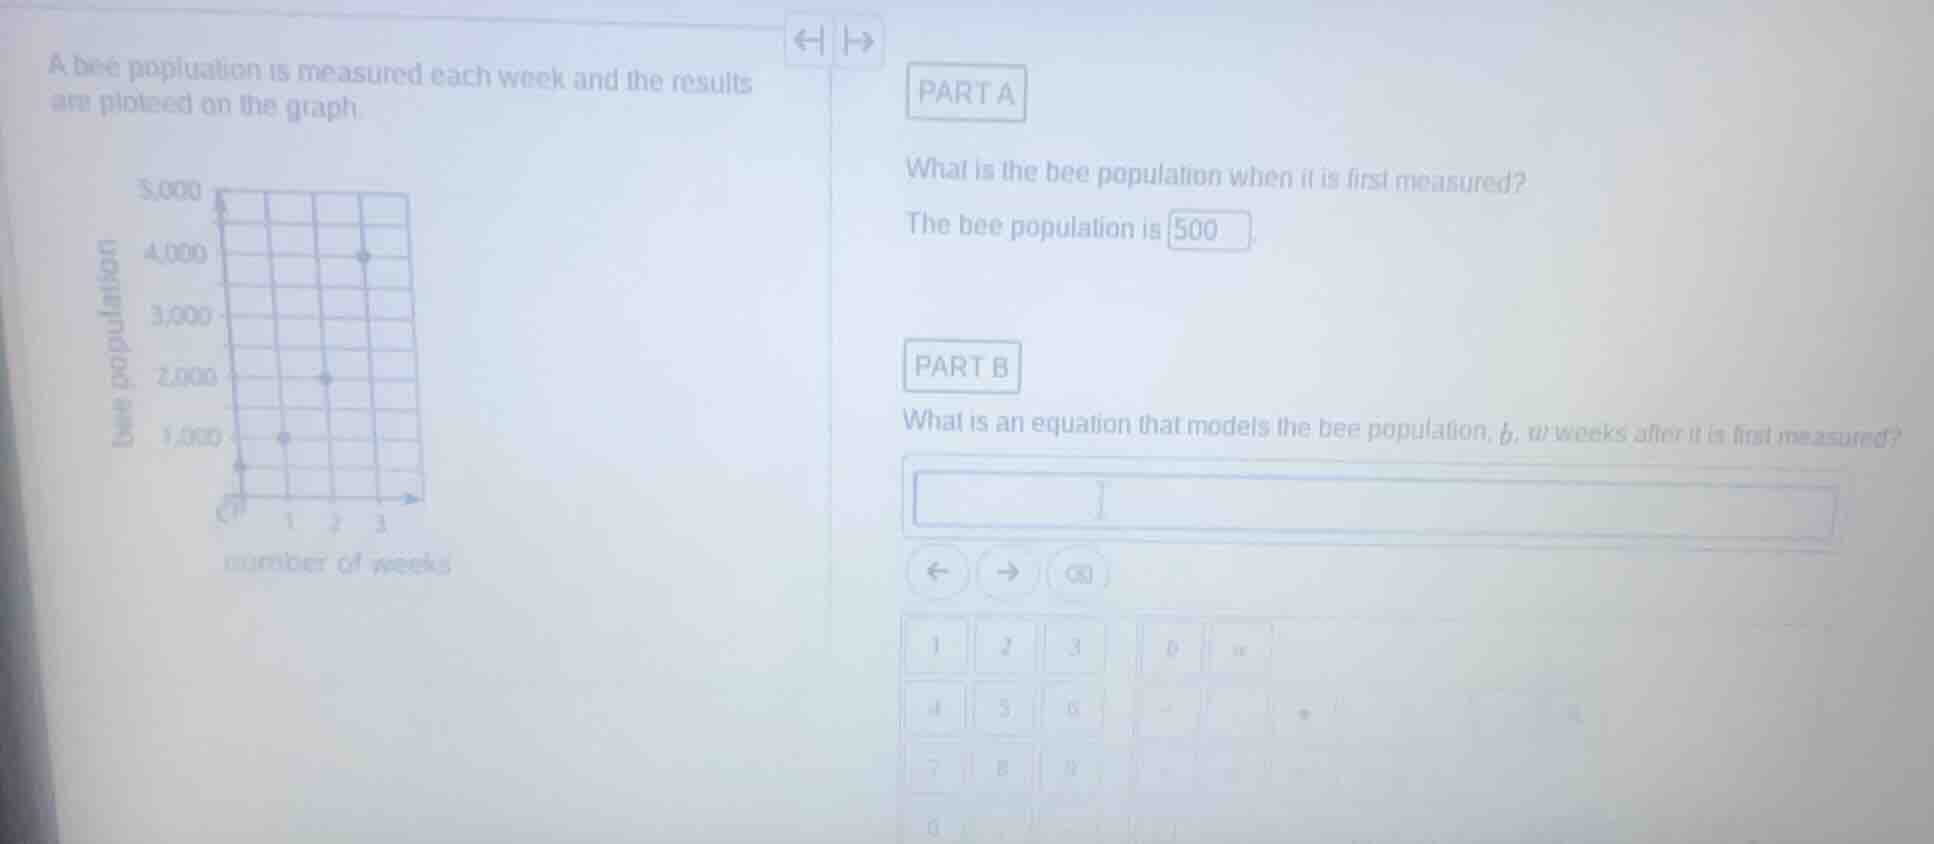
a bee population is measured each week and the results are plotted on the graph.
part a
what is the bee population when it is first measured?
the bee population is 500
part b
what is an equation that models the bee population, b, w weeks after it is first measured?
Part A
Step1: Identify the first measurement
The first measurement occurs at week 0 (when it is first measured). Looking at the graph, the y - value (bee population) at x = 0 (number of weeks = 0) is 500.
Step1: Determine the type of growth
From the graph, when \(w = 0\), \(b=500\); when \(w = 1\), \(b = 1000\); when \(w=2\), \(b = 2000\); when \(w = 3\), \(b=4000\). We can see that the population is doubling each week. So this is an exponential growth model of the form \(b=a\times r^{w}\), where \(a\) is the initial population and \(r\) is the growth factor.
Step2: Find the initial value (\(a\)) and growth factor (\(r\))
The initial population \(a\) (when \(w = 0\)) is 500. The growth factor \(r\) is \(\frac{1000}{500}=2\), \(\frac{2000}{1000} = 2\), \(\frac{4000}{2000}=2\), so \(r = 2\).
Step3: Write the equation
Substituting \(a = 500\) and \(r=2\) into the exponential growth formula \(b=a\times r^{w}\), we get \(b = 500\times2^{w}\).

Snap & solve any problem in the app
Get step-by-step solutions on Sovi AI
Photo-based solutions with guided steps
Explore more problems and detailed explanations
500