QUESTION IMAGE
Question
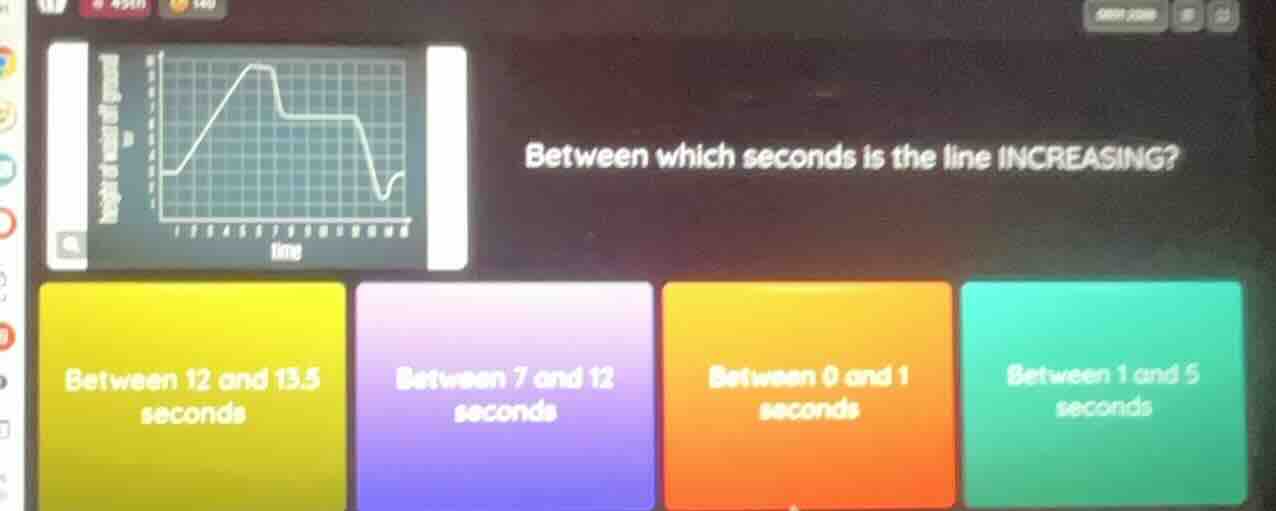
between which seconds is the line increasing?
between 12 and 13.5 seconds
between 7 and 12 seconds
between 0 and 1 seconds
between 1 and 5 seconds
Step1: Understand Increasing Line
A line (graph) is increasing when as time (x - axis) increases, the value on the y - axis (e.g., speed, distance) also increases. So we look for the interval where the graph is rising from left to right.
Step2: Analyze Each Option
- Option "Between 12 and 13.5 seconds": The graph here might be decreasing or fluctuating, not increasing.
- Option "Between 7 and 12 seconds": The graph is likely constant or decreasing here.
- Option "Between 0 and 1 seconds": The graph has a small change, but the main increasing part is more likely between 1 and 5.
- Option "Between 1 and 5 seconds": In this interval, as time (x) goes from 1 to 5, the y - value (from the graph's trend) is increasing, so the line is rising.

Snap & solve any problem in the app
Get step-by-step solutions on Sovi AI
Photo-based solutions with guided steps
Explore more problems and detailed explanations
D. Between 1 and 5 seconds (assuming the options are labeled as A: Between 12 and 13.5 seconds, B: Between 7 and 12 seconds, C: Between 0 and 1 seconds, D: Between 1 and 5 seconds)