QUESTION IMAGE
Question
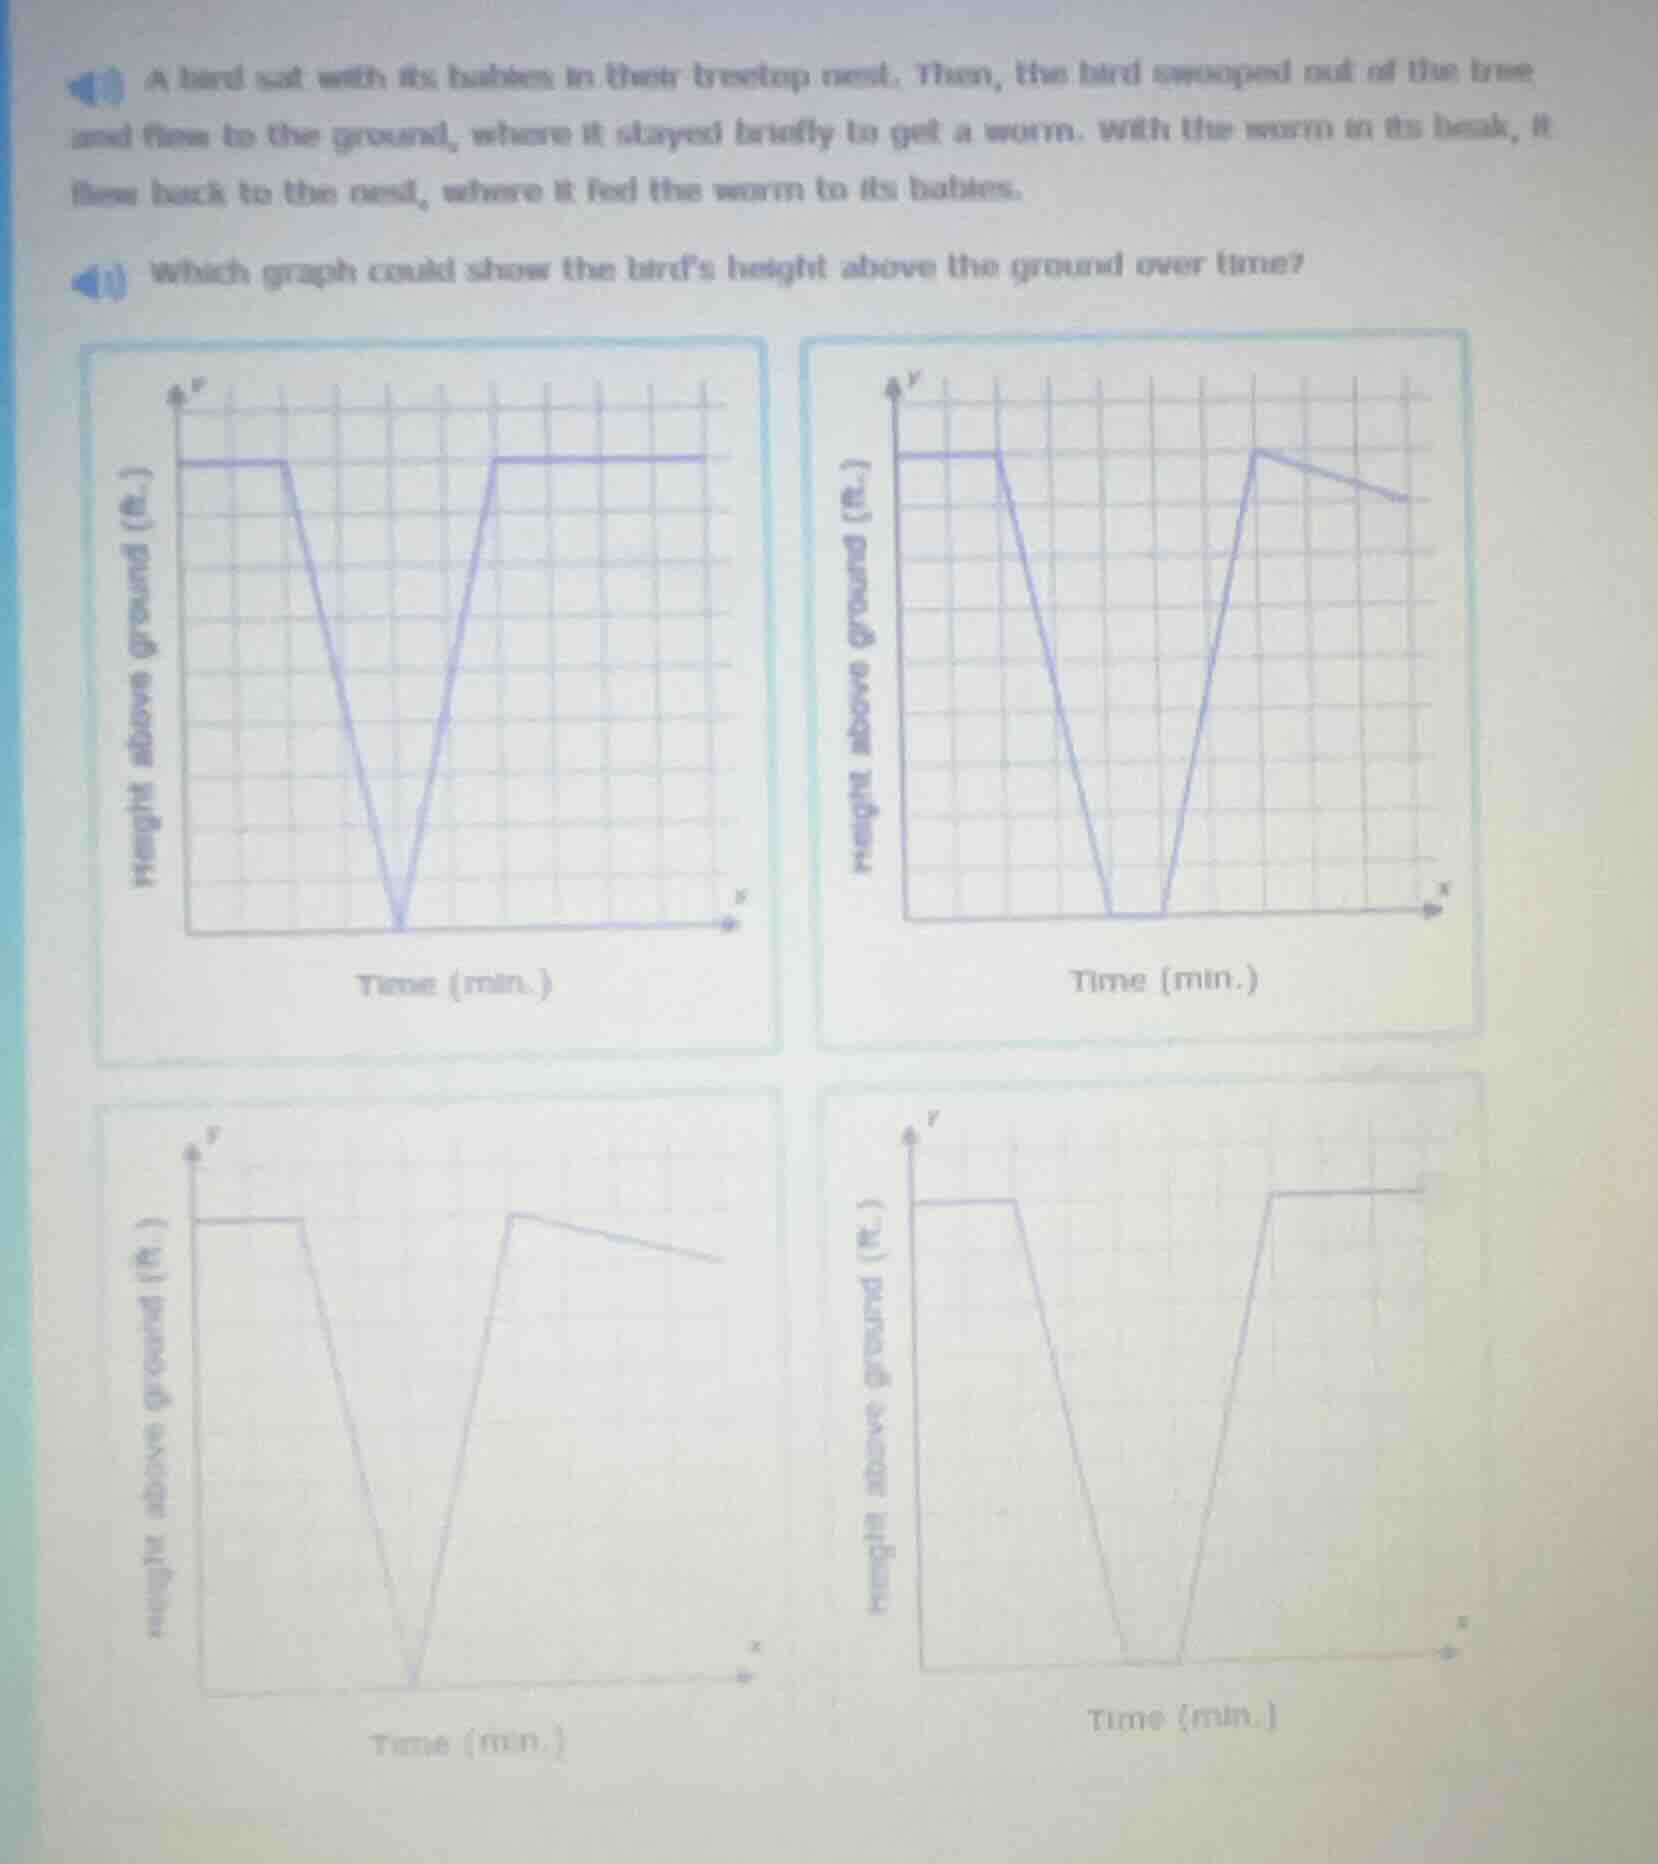
a bird sat with its babies in their treetop nest. then, the bird swooped out of the tree and flew to the ground, where it stayed briefly to get a worm. with the worm in its beak, it flew back to the nest, where it fed the worm to its babies. which graph could show the bird’s height above the ground over time?
Step1: Analyze initial bird state
The bird starts at a constant height in the nest, so the graph begins with a horizontal line.
Step2: Analyze descent to ground
The bird flies down to the ground, so the graph has a downward-sloping line to height = 0.
Step3: Analyze ground stay
The bird stays briefly on the ground, so the graph has a horizontal line at height = 0.
Step4: Analyze return to nest
The bird flies back to the original nest height, so the graph has an upward-sloping line to the initial height, followed by a horizontal line (staying at the nest).
Step5: Match to correct graph
Only the bottom-right graph follows all these stages: flat initial height, downward slope to 0, flat at 0, upward slope to initial height, flat at initial height.

Snap & solve any problem in the app
Get step-by-step solutions on Sovi AI
Photo-based solutions with guided steps
Explore more problems and detailed explanations
The bottom-right graph (with flat initial height, downward slope to 0, flat segment at 0, upward slope back to initial height, and final flat segment at initial height)