QUESTION IMAGE
Question
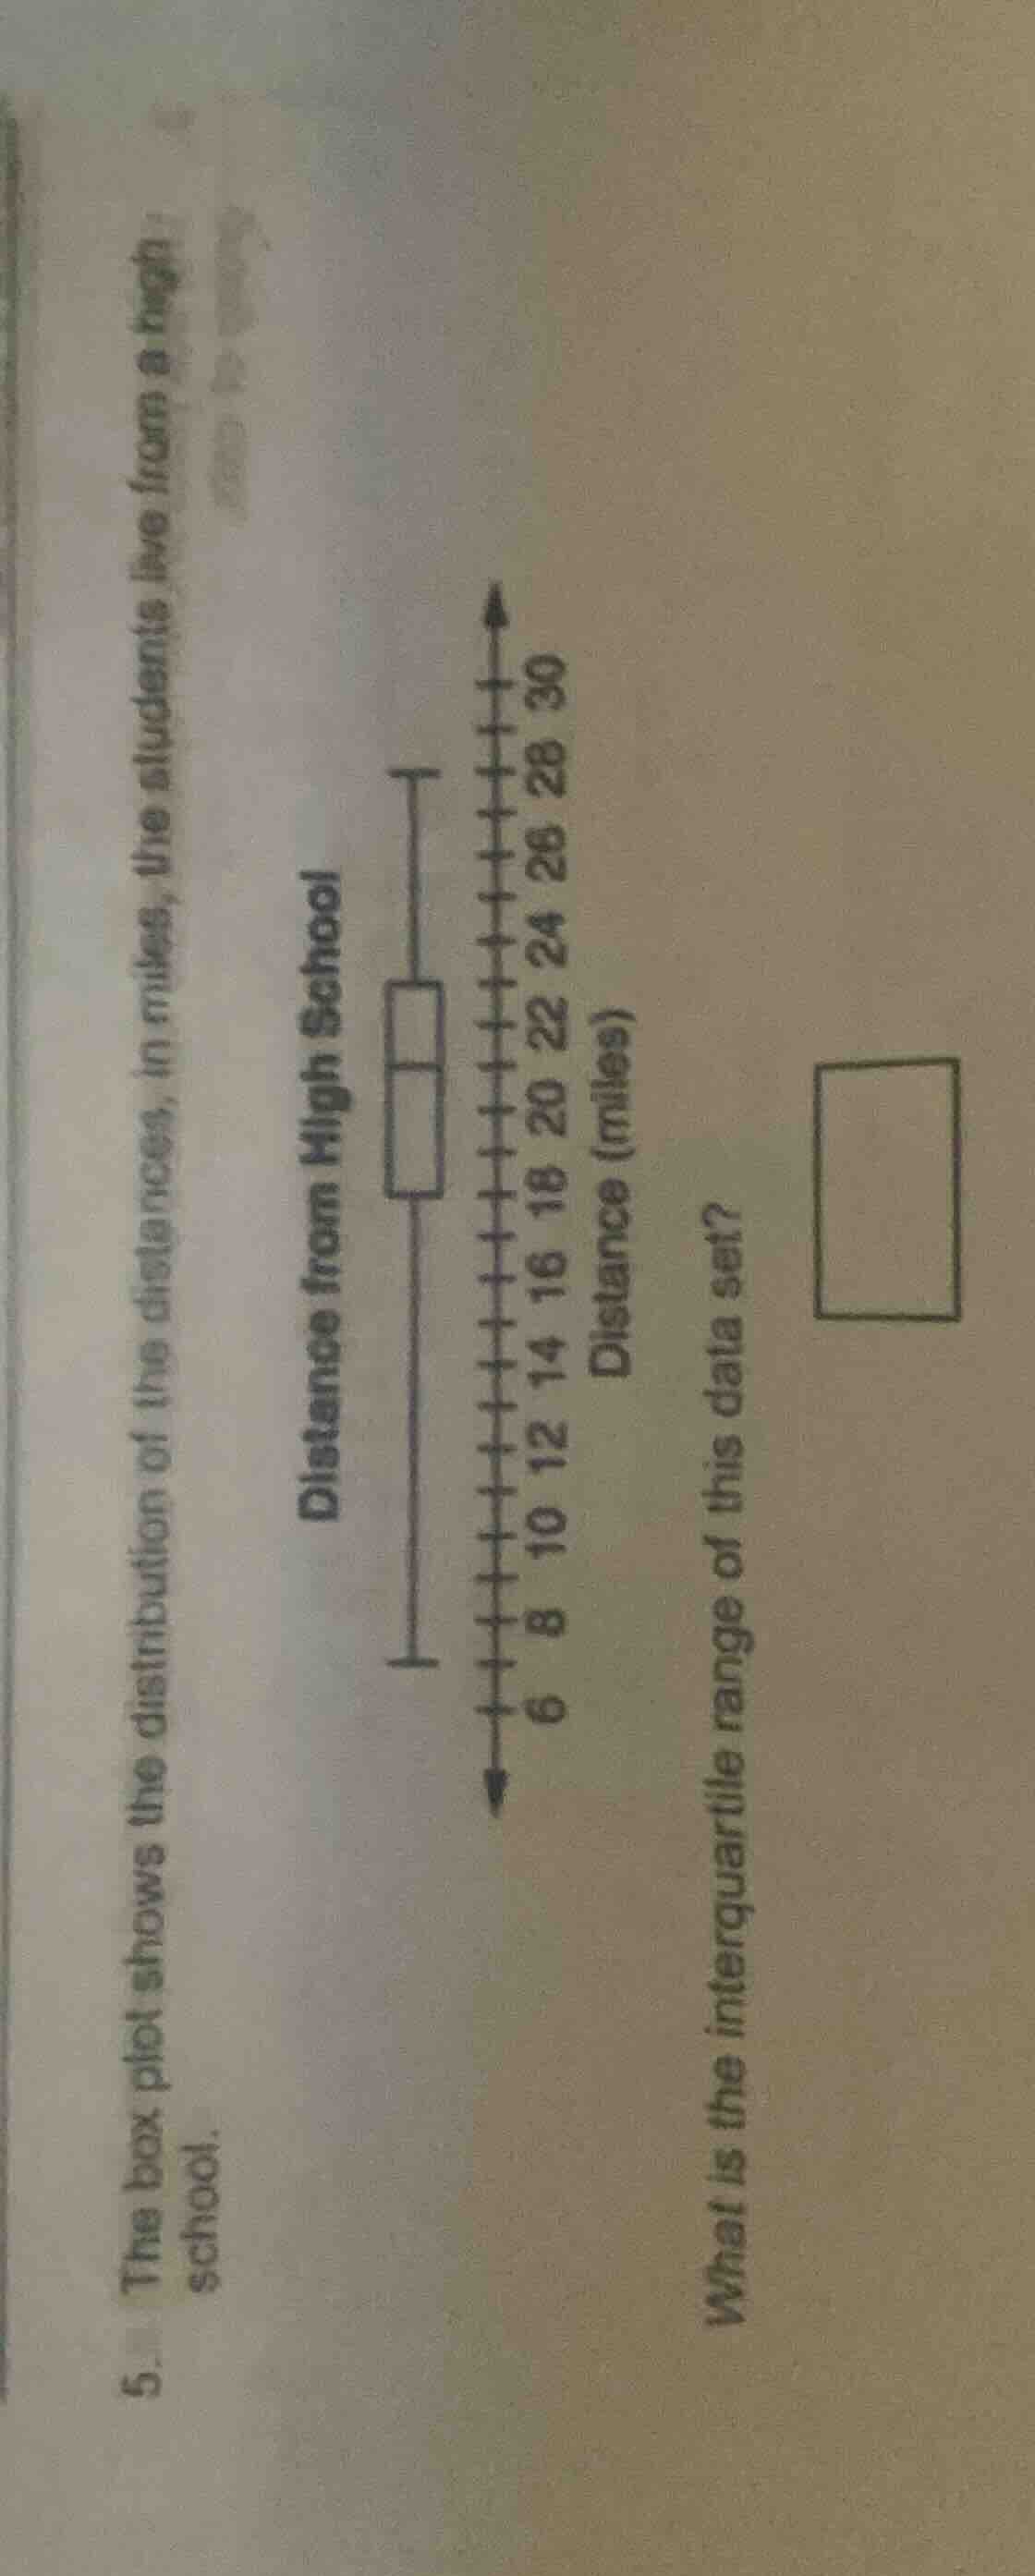
- the box plot shows the distribution of the distances, in miles, the students live from a high school.
distance from high school
distance (miles)
what is the interquartile range of this data set?
Step1: Identify Q1 and Q3
From the box plot, Q1 (lower quartile) = 16 miles, Q3 (upper quartile) = 22 miles.
Step2: Calculate interquartile range
Subtract Q1 from Q3: $\text{IQR} = Q3 - Q1$
$\text{IQR} = 22 - 16$

Snap & solve any problem in the app
Get step-by-step solutions on Sovi AI
Photo-based solutions with guided steps
Explore more problems and detailed explanations
6 miles