QUESTION IMAGE
Question
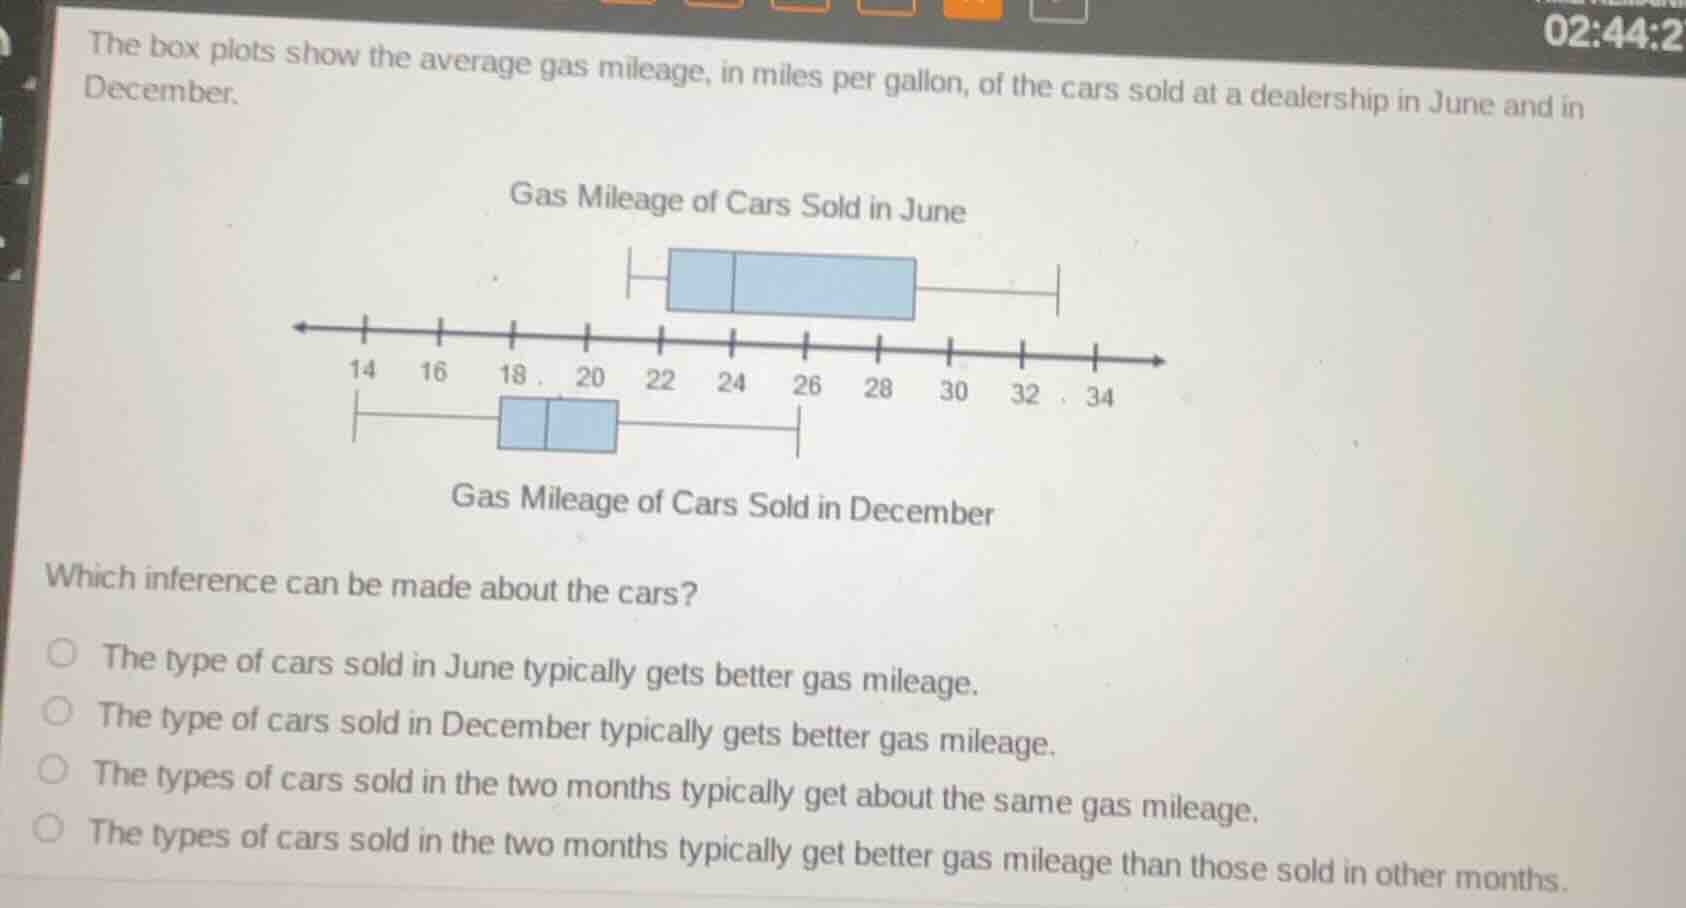
the box plots show the average gas mileage, in miles per gallon, of the cars sold at a dealership in june and in december.
gas mileage of cars sold in june
box plot for june
gas mileage of cars sold in december
box plot for december
which inference can be made about the cars?
- the type of cars sold in june typically gets better gas mileage.
- the type of cars sold in december typically gets better gas mileage.
- the types of cars sold in the two months typically get about the same gas mileage.
- the types of cars sold in the two months typically get better gas mileage than those sold in other months.
Brief Explanations
To determine the typical gas mileage, we look at the median (the line inside each box plot). For June, the median is 24 mpg. For December, the median is 18 mpg. A higher median indicates better typical gas mileage.

Snap & solve any problem in the app
Get step-by-step solutions on Sovi AI
Photo-based solutions with guided steps
Explore more problems and detailed explanations
The type of cars sold in June typically gets better gas mileage.