QUESTION IMAGE
Question
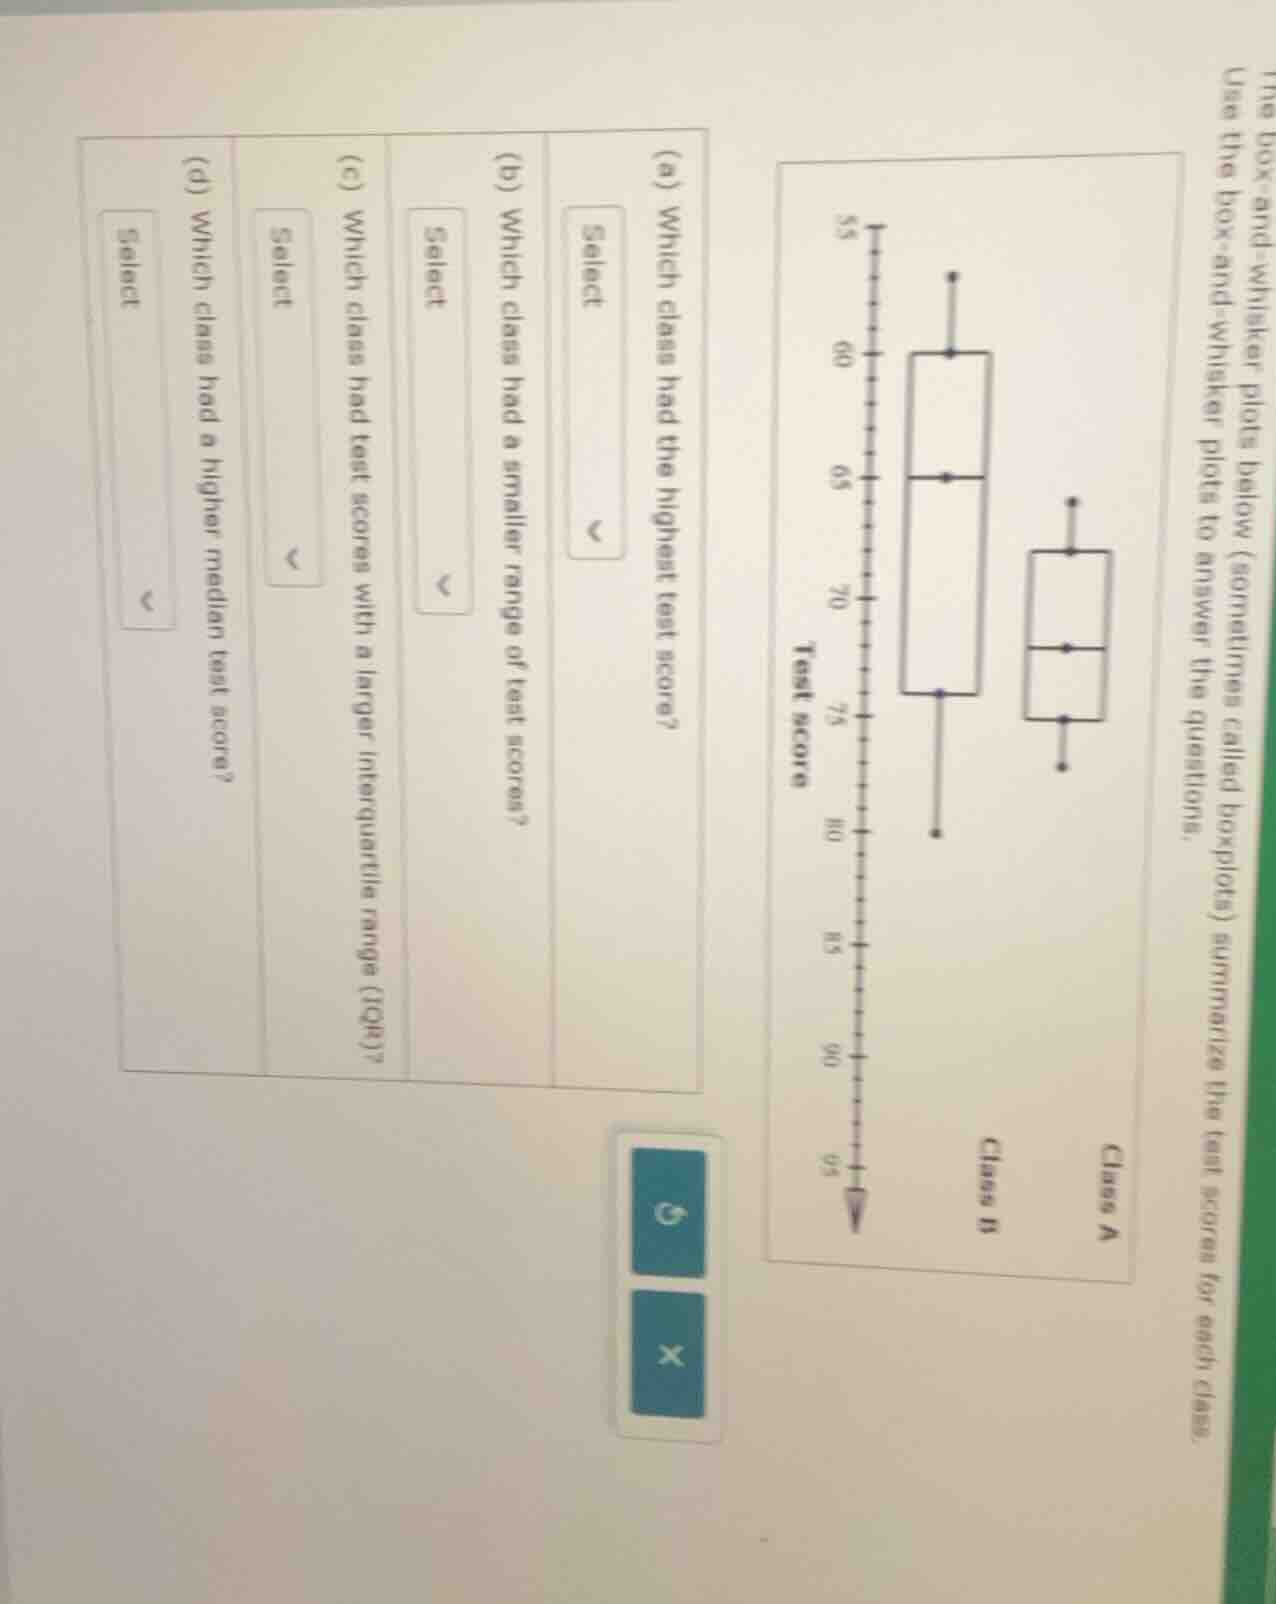
the box - and - whisker plots below (sometimes called boxplots) summarize the test scores for each class. use the box - and - whisker plots to answer the questions.
(a) which class had the highest test score?
select
(b) which class had a smaller range of test scores?
select
(c) which class had test scores with a larger interquartile range (iqr)?
select
(d) which class had a higher median test score?
select
Step1: Identify highest test score
For Class A, highest score = 78; for Class B, highest score = 80.
Step2: Calculate range for each class
Range = Max - Min.
Class A: $78 - 72 = 6$
Class B: $80 - 57 = 23$
Step3: Calculate IQR for each class
IQR = Q3 - Q1.
Class A: $76 - 73 = 3$
Class B: $75 - 60 = 15$
Step4: Identify median for each class
Class A median = 74; Class B median = 65.

Snap & solve any problem in the app
Get step-by-step solutions on Sovi AI
Photo-based solutions with guided steps
Explore more problems and detailed explanations
(a) Class B
(b) Class A
(c) Class B
(d) Class A