QUESTION IMAGE
Question
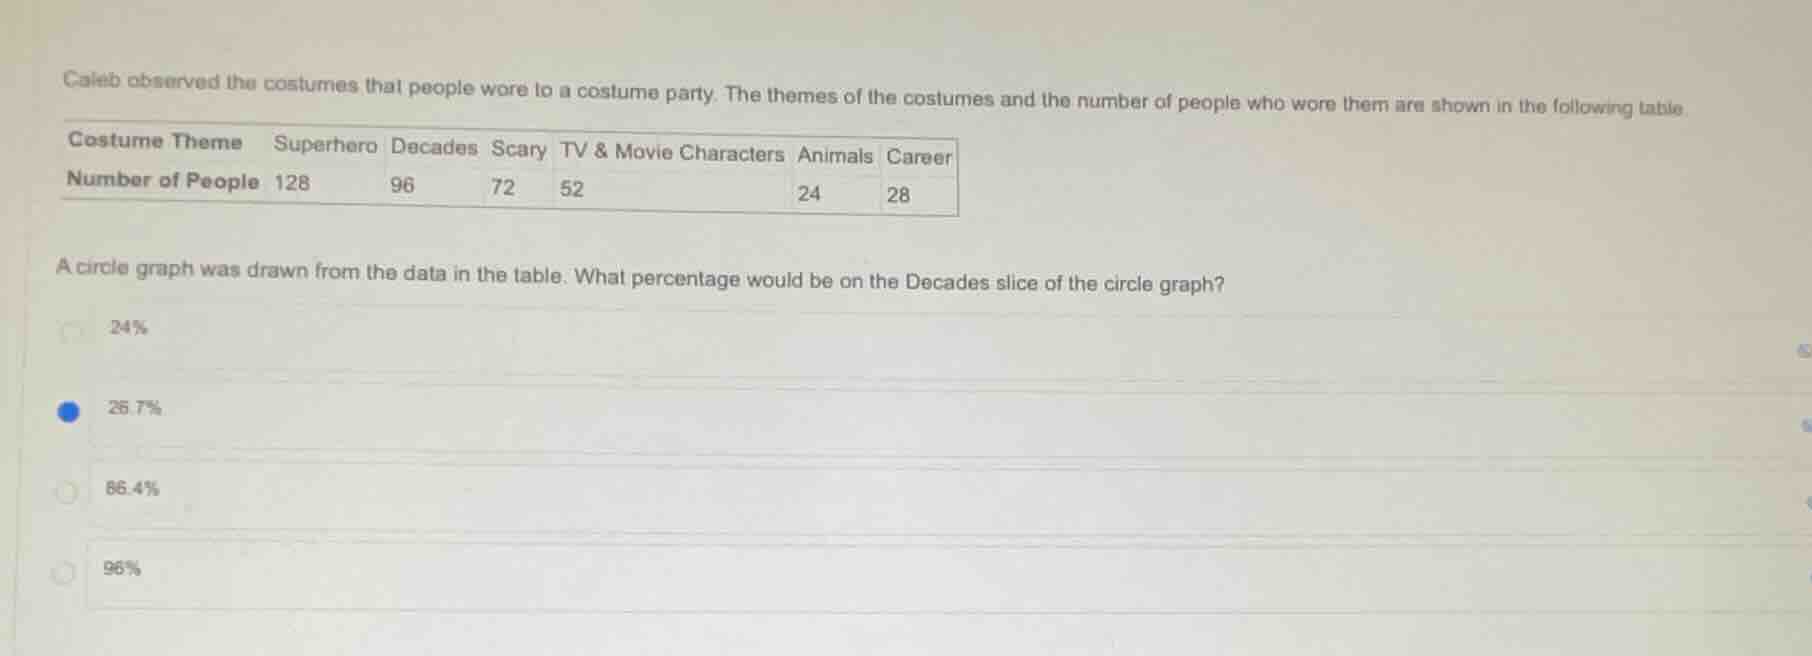
caleb observed the costumes that people wore to a costume party. the themes of the costumes and the number of people who wore them are shown in the following table
costume theme superhero decades scary tv & movie characters animals career
number of people 128 96 72 52 24 28
a circle graph was drawn from the data in the table. what percentage would be on the decades slice of the circle graph?
24%
26.7%
86.4%
96%
Step1: Calculate total number of people
$128 + 96 + 72 + 52 + 24 + 28 = 400$
Step2: Find percentage for Decades
$\frac{96}{400} \times 100\% = 24\%$

Snap & solve any problem in the app
Get step-by-step solutions on Sovi AI
Photo-based solutions with guided steps
Explore more problems and detailed explanations
24%