QUESTION IMAGE
Question
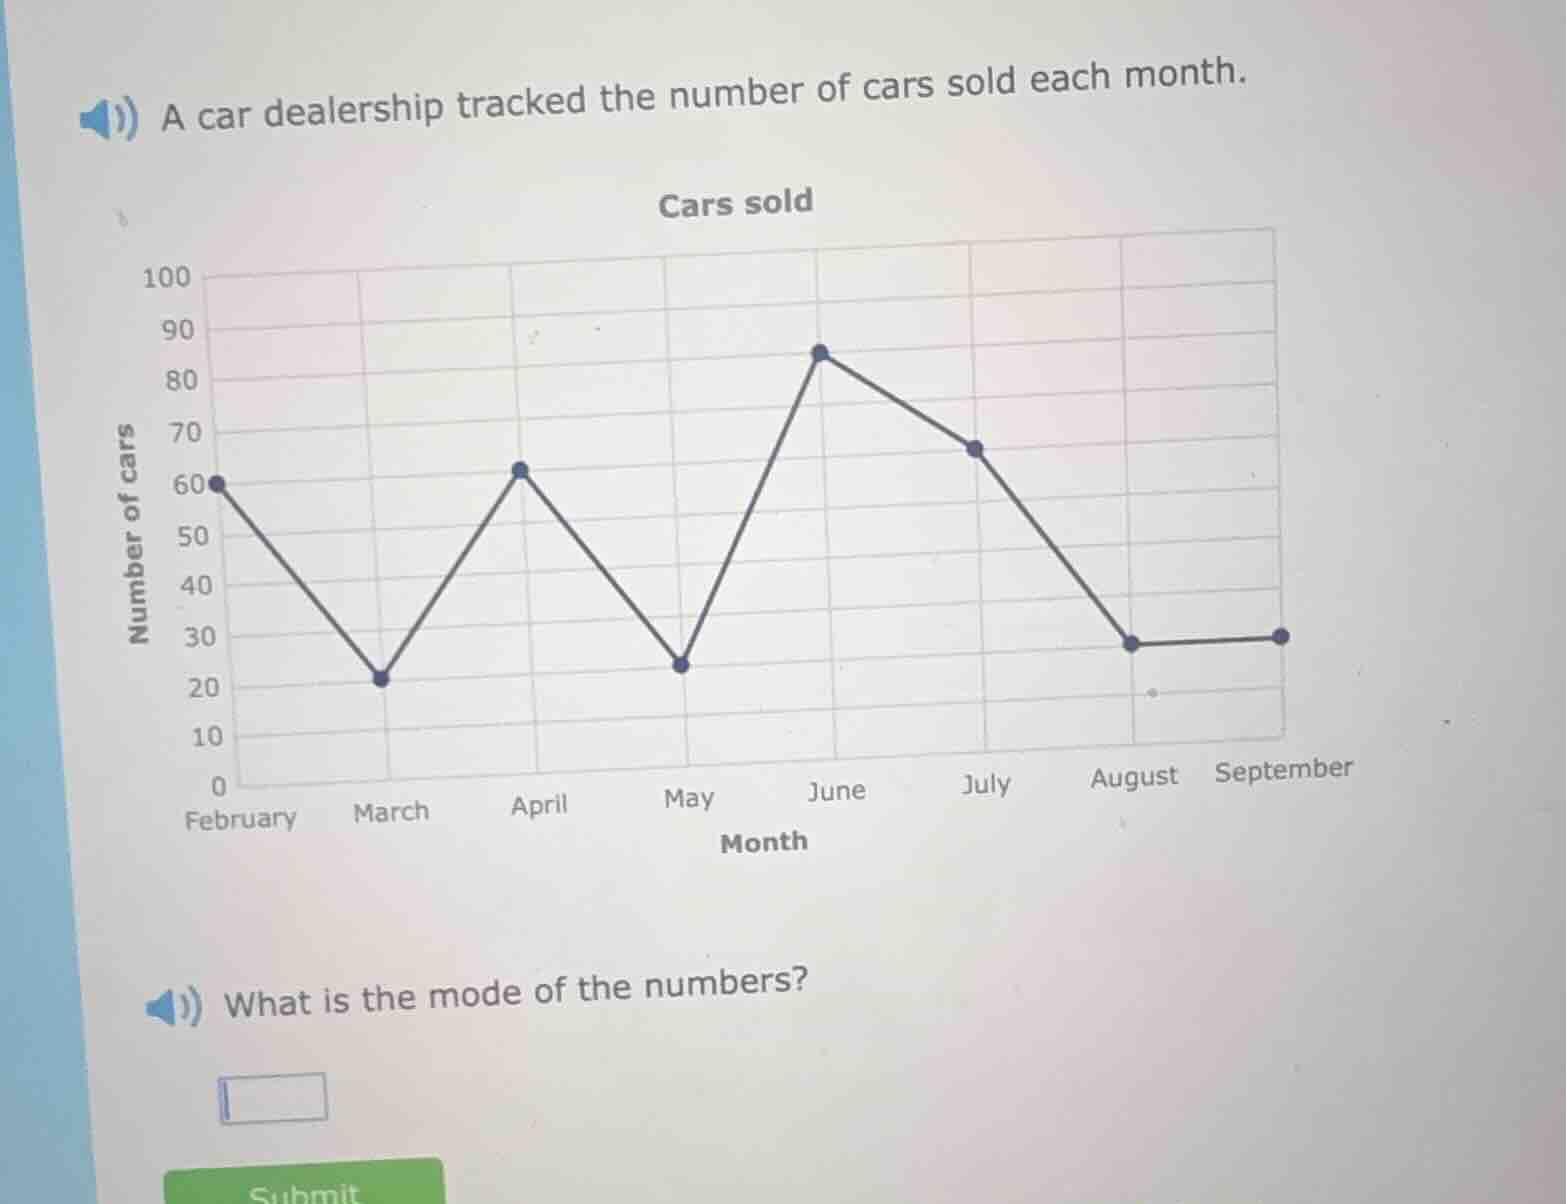
a car dealership tracked the number of cars sold each month. what is the mode of the numbers?
Step1: Identify the number of cars sold each month
From the graph:
- February: 60
- March: 20
- April: 63 (wait, looking again, April's dot is at 60? Wait, no, let's check the y-axis. The y-axis has 10,20,30,40,50,60,70,80,90,100. So:
- February: 60 (at y=60)
- March: 20 (at y=20)
- April: 60? Wait, no, April's dot is at the same level as February? Wait, no, let's re-express:
Wait, the points:
February: 60
March: 20
April: 60? Wait, no, April's y-coordinate: the grid lines. Let's list all values:
February: 60
March: 20
April: 60? Wait, no, maybe I misread. Wait, May: 25? No, the y-axis is 0,10,20,30,40,50,60,70,80,90,100. So each grid line is 10. So:
February: 60 (on the 60 line)
March: 20 (on the 20 line)
April: 60 (on the 60 line? Wait, no, April's dot is at the same height as February? Wait, no, maybe April is 63? No, the graph is a line plot. Let's list all the values:
February: 60
March: 20
April: 60 (wait, no, maybe April is 60? Wait, May: 25? No, May's dot is at 20-30? Wait, no, the y-axis is 20,30,... So May: 25? No, the problem is to find the mode, which is the most frequent value. Let's list all the numbers:
February: 60
March: 20
April: 60 (wait, no, maybe April is 60? Wait, May: 25? No, May's dot is at 20-30? Wait, no, let's check again:
Wait, the months: February, March, April, May, June, July, August, September.
Their car sales:
February: 60
March: 20
April: 60 (wait, the dot for April is at the same level as February? So 60)
May: 25? No, May's dot is at 20-30? Wait, no, the y-axis is 0,10,20,30,40,50,60,70,80,90,100. So each major grid line is 10. So:
February: 60
March: 20
April: 60 (on the 60 line)
May: 25? No, May's dot is between 20 and 30? Wait, no, the problem is to find the mode. Wait, maybe I made a mistake. Let's list all the values correctly:
Looking at the graph:
- February: 60
- March: 20
- April: 60 (same as February)
- May: 25? No, May's y-coordinate: the line is at 20-30? Wait, no, the graph's y-axis is labeled "Number of cars" with 0,10,20,30,40,50,60,70,80,90,100. So each horizontal line is 10. So:
February: 60 (on the 60 line)
March: 20 (on the 20 line)
April: 60 (on the 60 line)
May: 25? No, May's dot is at 20-30? Wait, no, May's value: the dot is at the 20-30 line? Wait, no, the problem is to find the mode. Wait, maybe the values are:
February: 60
March: 20
April: 60
May: 25? No, maybe I misread. Wait, June: 85 (on the 80-90 line, closer to 85? No, the dot is at 85? Wait, no, the y-axis is 0-100, so June's dot is at 85? No, the grid lines are 10 apart. So June: 85? No, maybe June is 80? Wait, no, the dot is at 85? Wait, no, let's list all the values as per the graph:
February: 60
March: 20
April: 60
May: 25? No, May's dot is at 20-30? Wait, no, the problem is to find the mode, which is the most frequent number. Let's check the counts:
60: February, April, and maybe others? Wait, August: 30, September: 30. Wait, no, August and September are both 30. Wait, let's re-express all values:
February: 60
March: 20
April: 60
May: 25? No, May's dot is at 20-30? Wait, no, the y-axis is 0,10,20,30,40,50,60,70,80,90,100. So each grid line is 10. So:
February: 60 (y=60)
March: 20 (y=20)
April: 60 (y=60)
May: 25? No, May's y is 25? No, the dot is at 20-30, so 25? Wait, no, maybe May is 25, June is 85, July is 65, August is 30, September is 30. Wait, no, this is confusing. Wait, the key is the mode: the number that appears most often.
Wait, let's list all the values correctly:
From the graph:
- February: 60
- March: 20
- April: 60
- May: 25 (no, May's dot is at 20-30, so…

Snap & solve any problem in the app
Get step-by-step solutions on Sovi AI
Photo-based solutions with guided steps
Explore more problems and detailed explanations
60