QUESTION IMAGE
Question
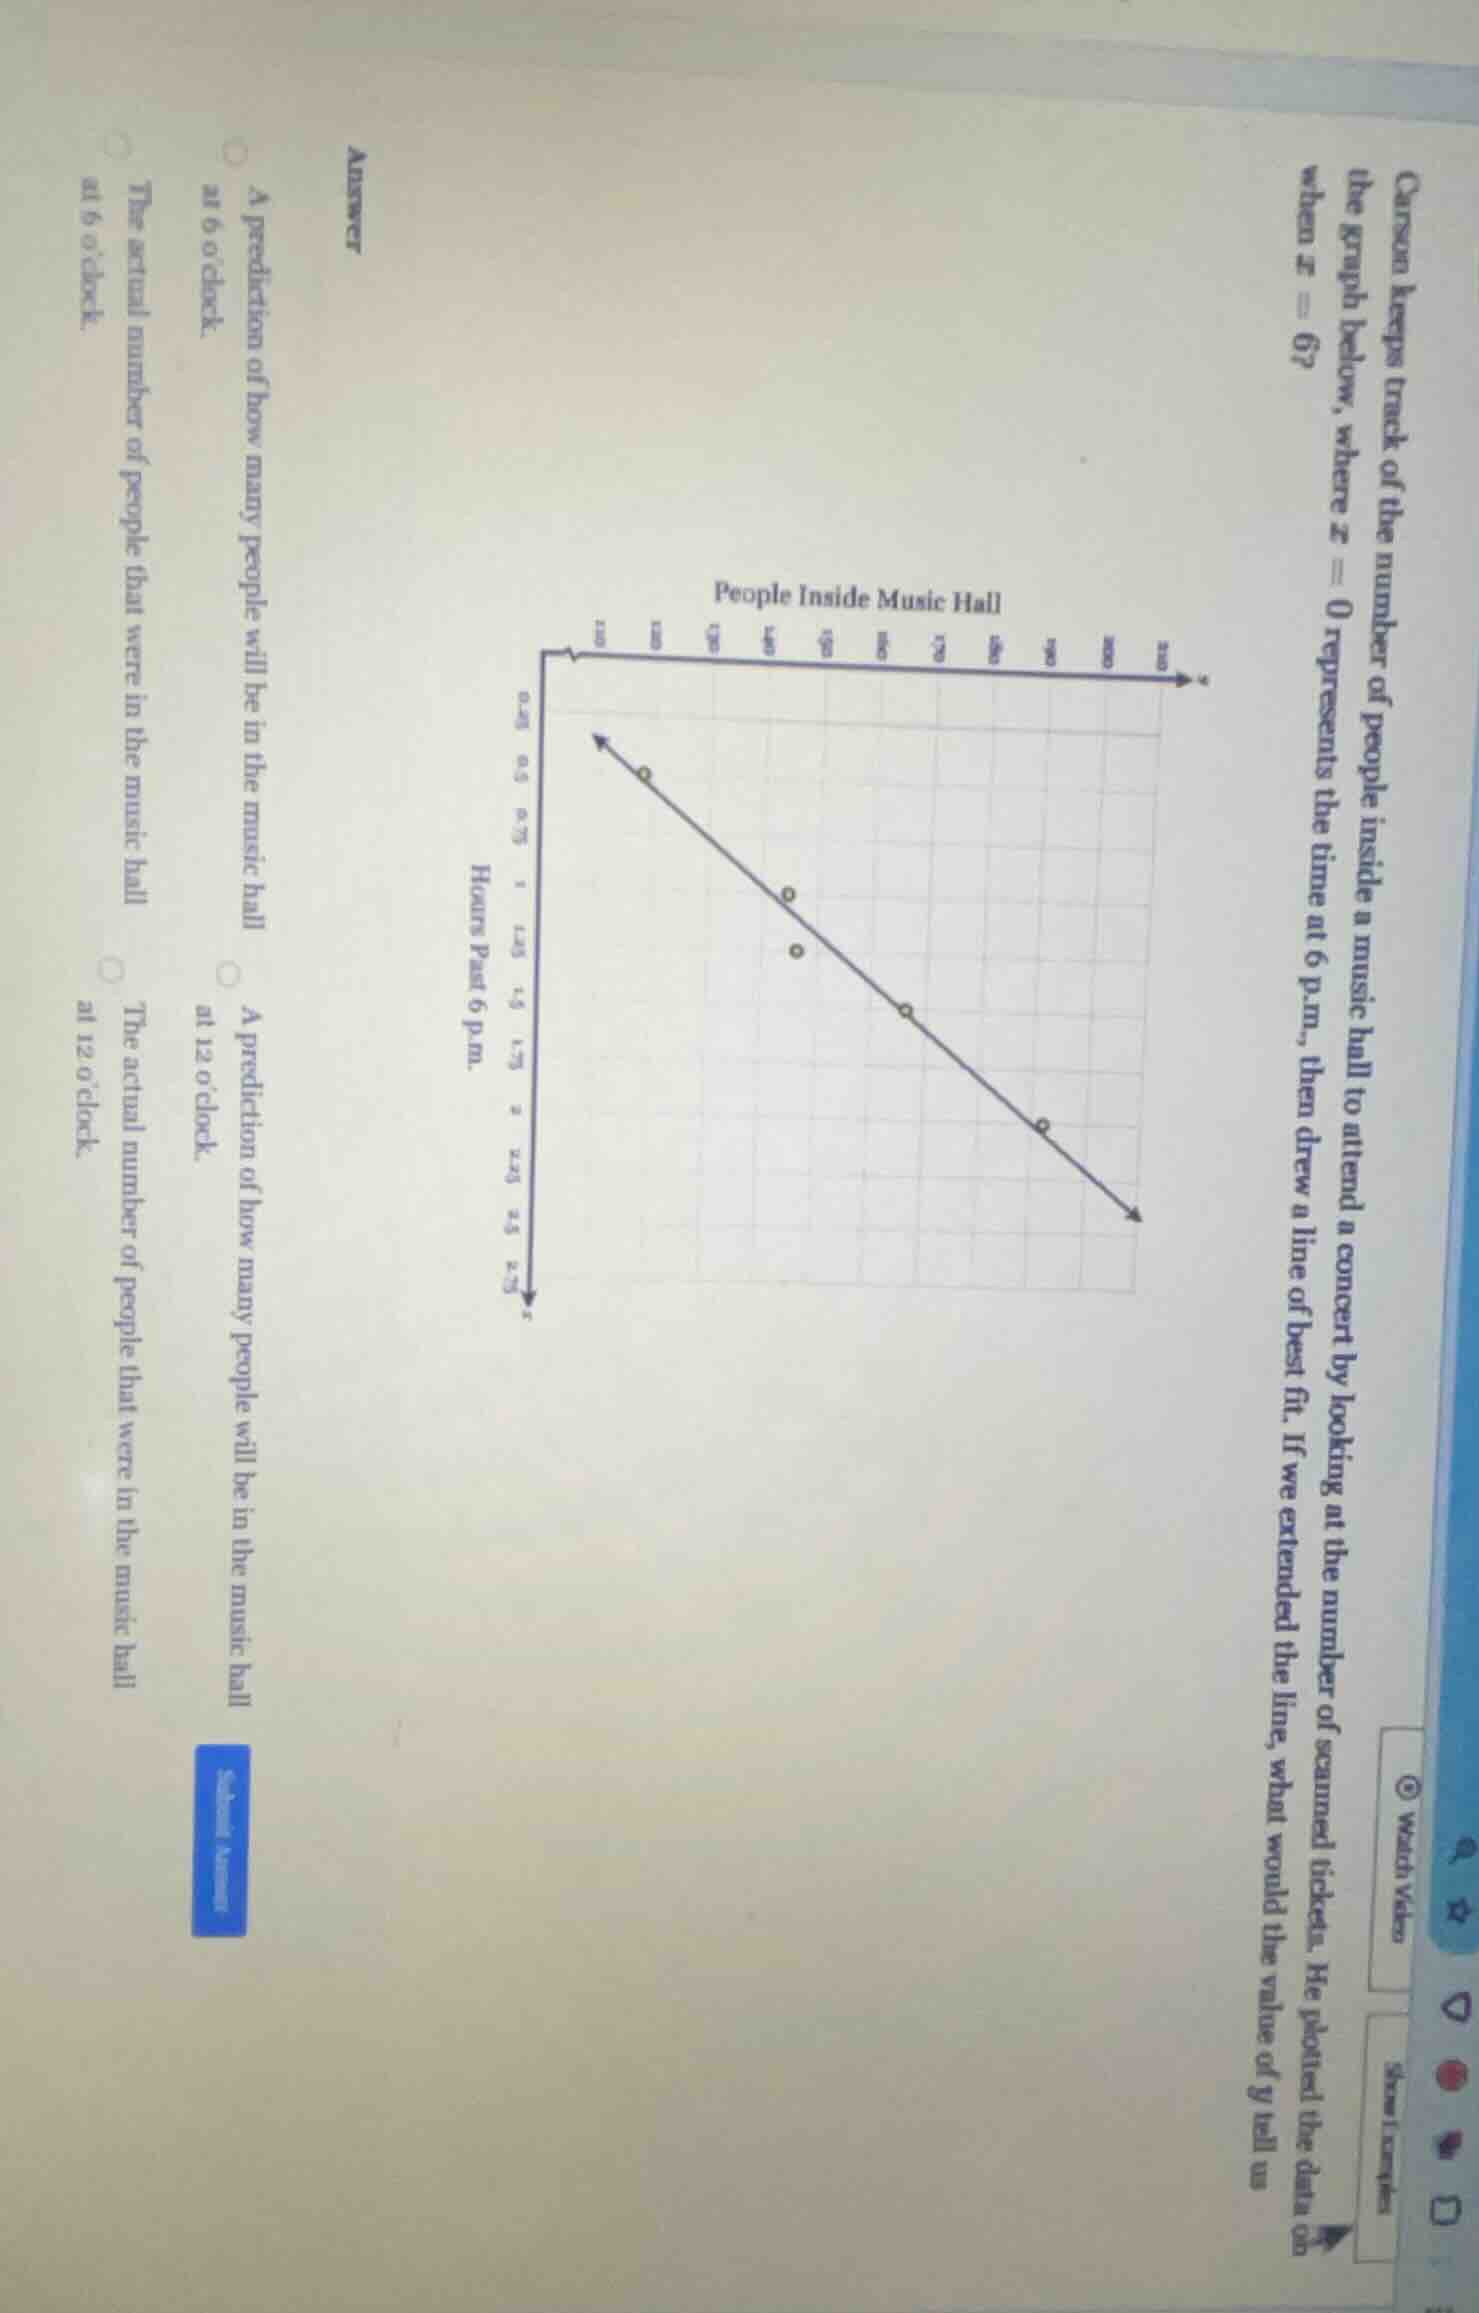
carson keeps track of the number of people inside a music hall to attend a concert by looking at the number of scanned tickets. he plotted the data on the graph below, where ( x = 0 ) represents the time at 6 p.m., then drew a line of best fit. if we extended the line, what would the value of ( y ) tell us when ( x = 6 )?
answer
a prediction of how many people will be in the music hall at 6 oclock.
a prediction of how many people will be in the music hall at 12 oclock.
the actual number of people that were in the music hall at 6 oclock.
the actual number of people that were in the music hall at 12 oclock.
The line of best fit is used for prediction. \( x = 0 \) is 6 p.m., so \( x = 6 \) would be 6 hours after 6 p.m., which is 12 a.m. (or 12 o'clock). The line of best fit gives a predicted value, not the actual number (actual data is from the plotted points, not the line extension). So it's a prediction of people in the hall at 12 o'clock.

Snap & solve any problem in the app
Get step-by-step solutions on Sovi AI
Photo-based solutions with guided steps
Explore more problems and detailed explanations
A prediction of how many people will be in the music hall at 12 o'clock.