QUESTION IMAGE
Question
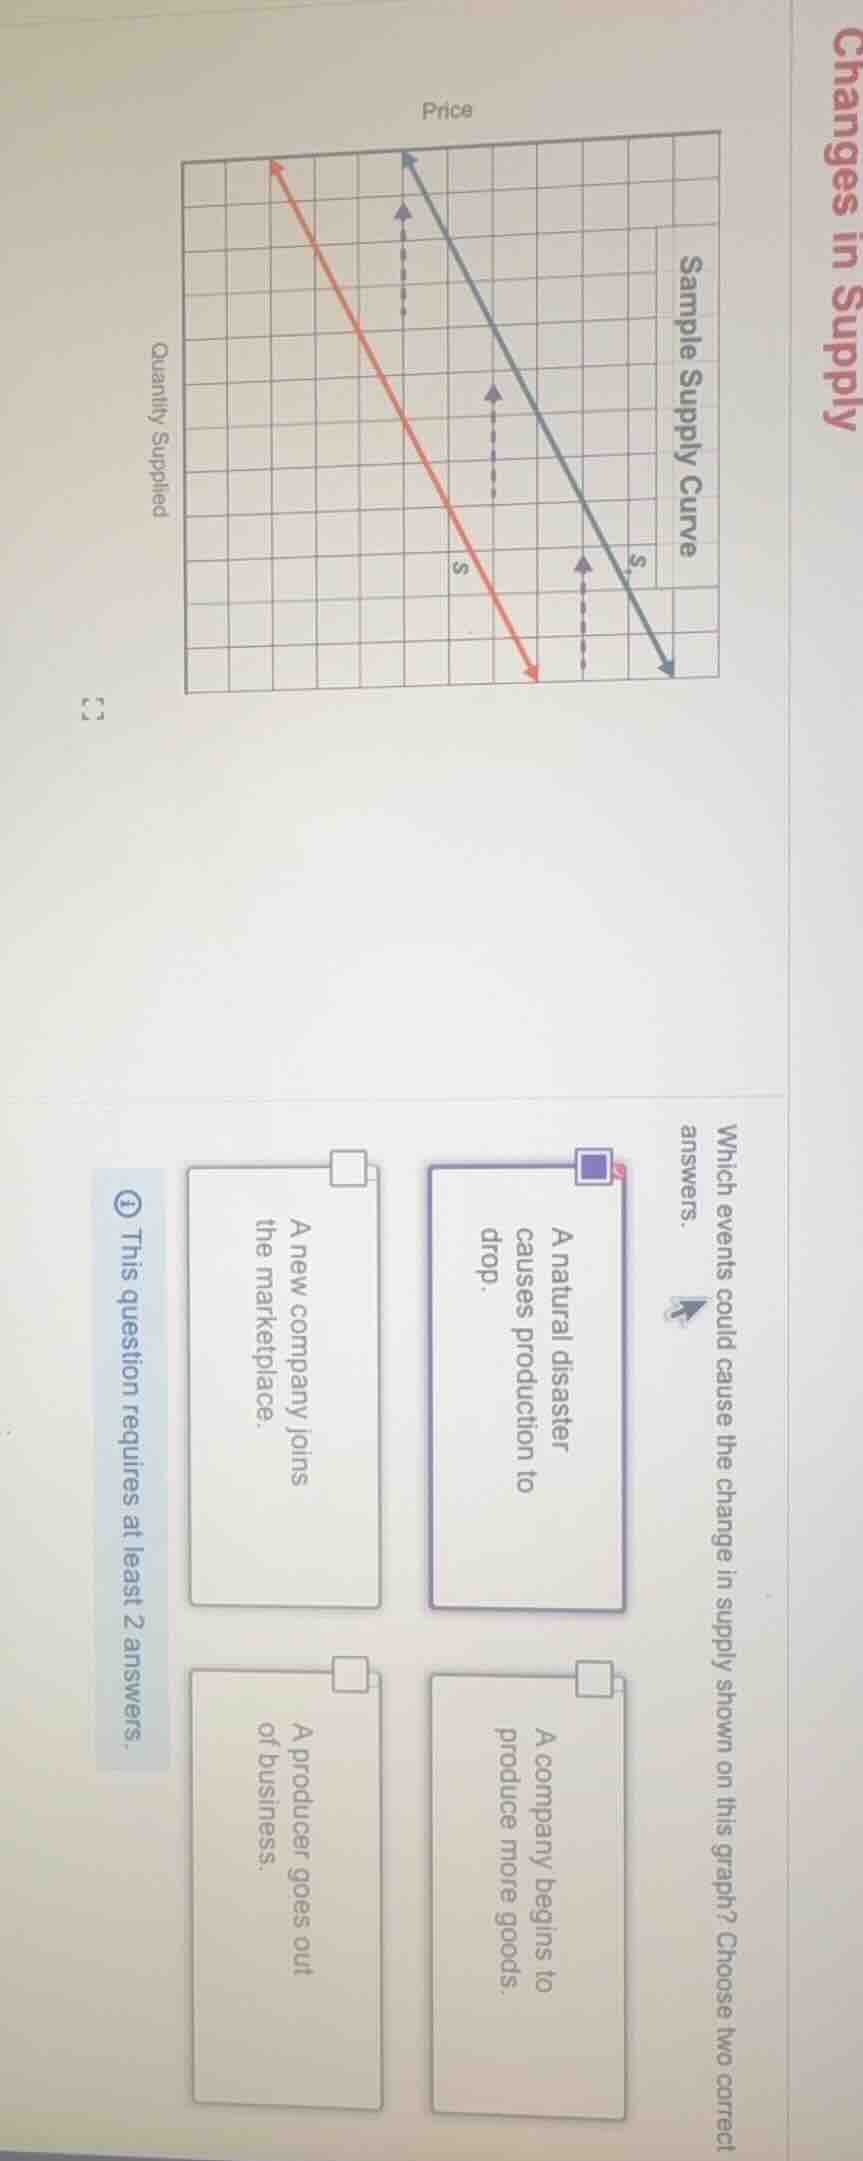
changes in supply
sample supply curve
which events could cause the change in supply shown on this graph? choose two correct answers.
a natural disaster causes production to drop.
a new company joins the marketplace.
a company begins to produce more goods.
a producer goes out of business.
this question requires at least 2 answers.
The graph shows a leftward shift of the supply curve, which means a decrease in overall supply (less quantity supplied at every price level).
- A natural disaster that reduces production will decrease the total goods available, shifting supply left.
- A producer going out of business reduces the number of suppliers, decreasing total market supply and shifting the curve left.
A new company joining or a company producing more would increase supply, shifting the curve right, so these do not match the graph.

Snap & solve any problem in the app
Get step-by-step solutions on Sovi AI
Photo-based solutions with guided steps
Explore more problems and detailed explanations
- A natural disaster causes production to drop.
- A producer goes out of business.