QUESTION IMAGE
Question
chapter 2 - target practice
file home insert share page layout formulas data review view automate help draw
ping pong crumpled paper
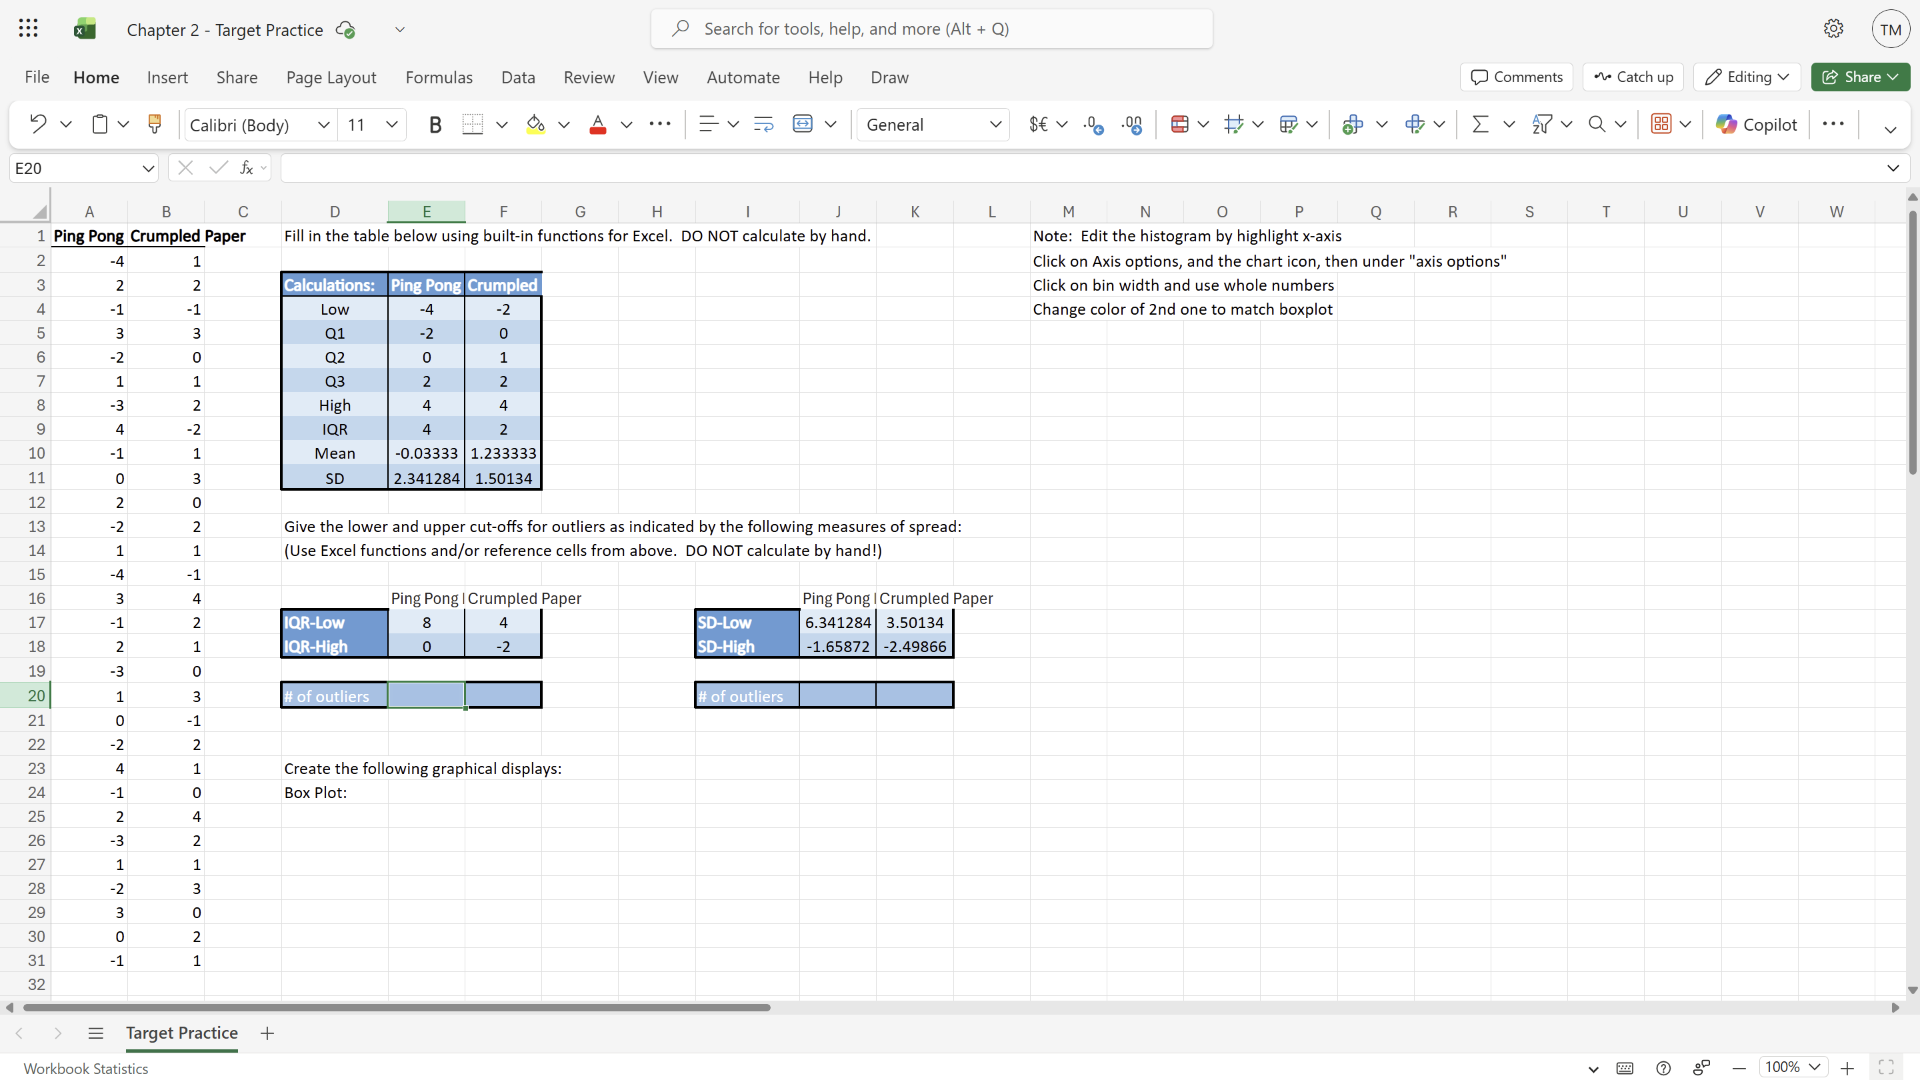
fill in the table below using built-in functions for excel. do not calculate by hand.
note: edit the histogram by highlight x-axis
click on axis options, and the chart icon, then under \axis options\
click on bin width and use whole numbers
change color of 2nd one to match boxplot
calculations:| | ping pong | crumpled || ---- | ---- | ---- || low | -4 | -2 || q1 | -2 | 0 || q2 | 0 | 1 || q3 | 2 | 2 || high | 4 | 4 || iqr | 4 | 2 || mean | -0.03333 | 1.233333 || sd | 2.341284 | 1.50134 |give the lower and upper cut-offs for outliers as indicated by the following measures of spread:(use excel functions and/or reference cells from above. do not calculate by hand!)| | ping pong | crumpled paper || ---- | ---- | ---- || iqr-low | 8 | 4 || iqr-high | 0 | -2 || | ping pong | crumpled paper || ---- | ---- | ---- || sd-low | 6.341284 | 3.50134 || sd-high | -1.65872 | -2.49866 || # of outliers | | || ---- | ---- | ---- || # of outliers | | || ---- | ---- | ---- |create the following graphical displays:box plot:
Step1: Verify IQR cutoffs formula
IQR lower cutoff: $Q1 - 1.5 \times IQR$
IQR upper cutoff: $Q3 + 1.5 \times IQR$
Ping Ping:
$Q1=-2, IQR=4$: $-2 - 1.5\times4 = -8$ (corrected from 8)
$Q3=2, IQR=4$: $2 + 1.5\times4 = 8$
Crumpled Paper:
$Q1=0, IQR=2$: $0 - 1.5\times2 = -3$ (corrected from 4)
$Q3=2, IQR=2$: $2 + 1.5\times2 = 5$ (corrected from -2)
Step2: Verify SD cutoffs formula
SD lower cutoff: $\text{Mean} - 2\times SD$
SD upper cutoff: $\text{Mean} + 2\times SD$
Ping Pong:
$\text{Mean}=-0.03333, SD=2.341284$:
$-0.03333 - 2\times2.341284 = -4.7159$ (corrected from 6.341284)
$-0.03333 + 2\times2.341284 = 4.6492$ (corrected from -1.65872)
Crumpled Paper:
$\text{Mean}=1.23333, SD=1.50134$:
$1.23333 - 2\times1.50134 = -1.76935$ (corrected from 3.50134)
$1.23333 + 2\times1.50134 = 4.23601$ (corrected from -2.49866)
Step3: Count outliers (IQR rule)
Ping Pong data: {-4,-2,-1,3,-2,1,-3,4,-1,0,2,-2,1,-4,3,-1,2,-3,1,0,-2,4,-1,2,-3,1,-2,3,0,-1}
Values outside $(-8,8)$: None → 0 outliers
Crumpled Paper data: {1,2,-1,3,0,1,2,-2,1,3,0,2,1,-1,4,2,1,0,3,-1,2,1,0,4,2,1,3,0,2,1}
Values outside $(-3,5)$: None → 0 outliers
Step4: Count outliers (SD rule)
Ping Pong: Values outside $(-4.7159,4.6492)$: None → 0 outliers
Crumpled Paper: Values outside $(-1.76935,4.23601)$: None → 0 outliers

Snap & solve any problem in the app
Get step-by-step solutions on Sovi AI
Photo-based solutions with guided steps
Explore more problems and detailed explanations
Corrected Cut-Offs:
| Metric | Ping Pong | Crumpled Paper |
|---|---|---|
| IQR-High | 8 | 5 |
| SD-Low | -4.7159 | -1.76935 |
| SD-High | 4.6492 | 4.23601 |
Outlier Counts:
- IQR-based # of outliers: Ping Pong = 0, Crumpled Paper = 0
- SD-based # of outliers: Ping Pong = 0, Crumpled Paper = 0
Notes for Excel Implementation:
- For IQR cutoffs:
- Ping Pong IQR-Low:
=E4-1.5*E9 - Ping Pong IQR-High:
=E7+1.5*E9 - Crumpled IQR-Low:
=F4-1.5*F9 - Crumpled IQR-High:
=F7+1.5*F9
- For SD cutoffs:
- Ping Pong SD-Low:
=E10-2*E11 - Ping Pong SD-High:
=E10+2*E11 - Crumpled SD-Low:
=F10-2*F11 - Crumpled SD-High:
=F10+2*F11
- For outlier count (use
COUNTIFS):
- Ping Pong IQR outliers:
=COUNTIFS(A:A,"<"&Q17,A:A,">"&Q18) - Crumpled IQR outliers:
=COUNTIFS(B:B,"<"&R17,B:B,">"&R18)