QUESTION IMAGE
Question
charlotte-mecklenburg schools math 1 semester 1 unit 1 lesson 3 student
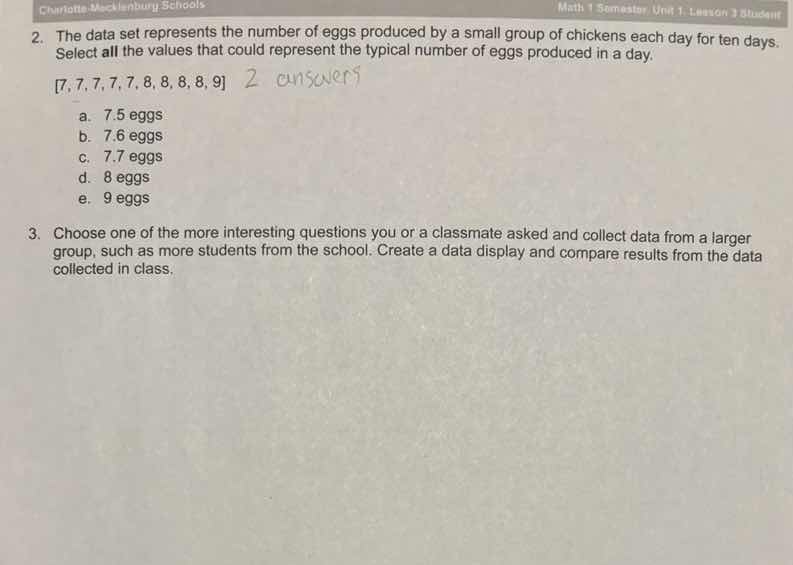
- the data set represents the number of eggs produced by a small group of chickens each day for ten days.
select all the values that could represent the typical number of eggs produced in a day.
7, 7, 7, 7, 7, 8, 8, 8, 8, 9
a. 7.5 eggs
b. 7.6 eggs
c. 7.7 eggs
d. 8 eggs
e. 9 eggs
- choose one of the more interesting questions you or a classmate asked and collect data from a larger
group, such as more students from the school. create a data display and compare results from the data
collected in class.
Step1: Calculate the mean
First, sum all values and divide by 10.
Sum = $7+7+7+7+7+8+8+8+8+9 = 75$
Mean = $\frac{75}{10} = 7.5$
Step2: Find the mode
Identify the most frequent value.
The value 7 appears 5 times, 8 appears 4 times, 9 appears 1 time. Mode = 7
Step3: Find the median
Order data, find middle value.
Ordered data: $[7,7,7,7,7,8,8,8,8,9]$. Median = $\frac{7+8}{2} = 7.5$
Step4: Identify typical values
Typical values include mean, median, mode. Valid options match these.

Snap & solve any problem in the app
Get step-by-step solutions on Sovi AI
Photo-based solutions with guided steps
Explore more problems and detailed explanations
a. 7.5 eggs
d. 8 eggs
Note: 8 is also a reasonable typical value as it is a common value in the dataset, while 7.5 is the mean/median which are standard measures of central tendency for typical value.