QUESTION IMAGE
Question
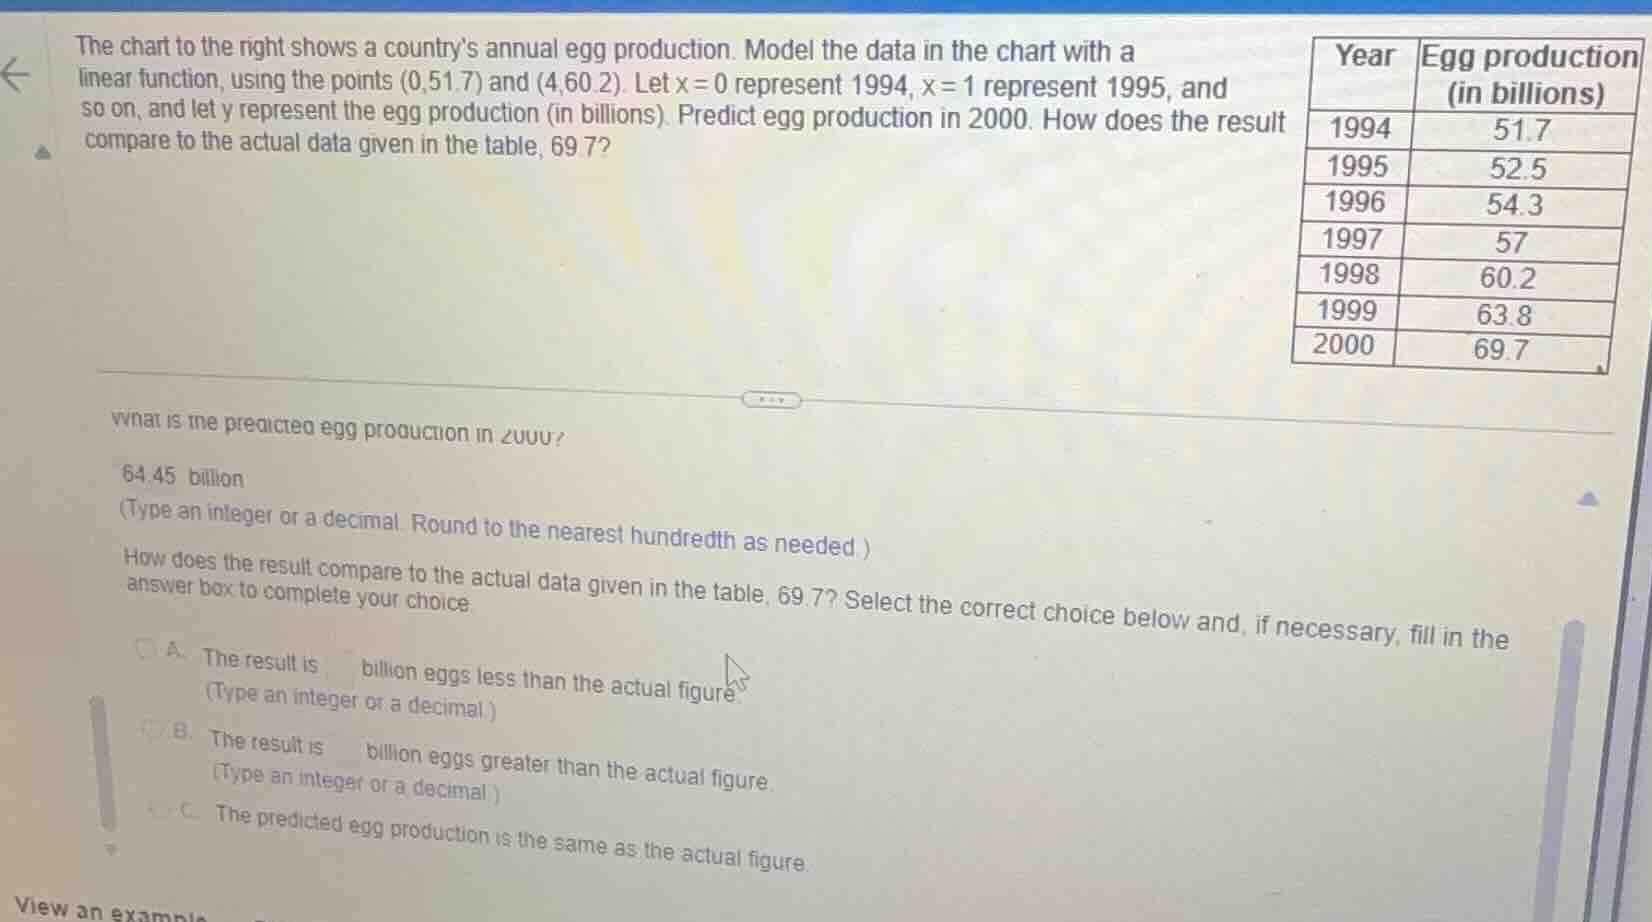
the chart to the right shows a countrys annual egg production. model the data in the chart with a linear function, using the points (0,51.7) and (4,60.2). let x = 0 represent 1994, x = 1 represent 1995, and so on, and let y represent the egg production (in billions). predict egg production in 2000. how does the result compare to the actual data given in the table, 69.7?
what is the predicted egg production in 2000?
64.45 billion
(type an integer or a decimal. round to the nearest hundredth as needed.)
how does the result compare to the actual data given in the table, 69.7? select the correct choice below and, if necessary, fill in the answer box to complete your choice.
a. the result is ___ billion eggs less than the actual figure.
(type an integer or a decimal.)
b. the result is ___ billion eggs greater than the actual figure.
(type an integer or a decimal.)
c. the predicted egg production is the same as the actual figure.
year | egg production (in billions)
1994 | 51.7
1995 | 52.5
1996 | 54.3
1997 | 57
1998 | 60.2
1999 | 63.8
2000 | 69.7
Step1: Find the slope of the line
The slope \( m \) between two points \((x_1, y_1)\) and \((x_2, y_2)\) is given by \( m=\frac{y_2 - y_1}{x_2 - x_1} \). Here, \((x_1, y_1)=(0, 51.7)\) and \((x_2, y_2)=(4, 60.2)\). So, \( m=\frac{60.2 - 51.7}{4 - 0}=\frac{8.5}{4}=2.125 \).
Step2: Find the equation of the line
Using the point - slope form \( y - y_1=m(x - x_1) \) with \((x_1, y_1)=(0, 51.7)\) (which is the y - intercept form \( y=mx + b \) where \( b = 51.7 \)), the equation of the line is \( y=2.125x+51.7 \).
Step3: Determine the value of \( x \) for 2000
Since \( x = 0 \) represents 1994, for 2000, \( x=2000 - 1994 = 6 \).
Step4: Predict the egg production in 2000
Substitute \( x = 6 \) into the equation \( y=2.125x + 51.7 \). So, \( y=2.125\times6+51.7=12.75 + 51.7=64.45 \) (in billions).
Step5: Compare with the actual value
The actual value in 2000 is 69.7. To find the difference, we calculate \( 69.7-64.45 = 5.25 \). So the predicted value is 5.25 billion less than the actual value.

Snap & solve any problem in the app
Get step-by-step solutions on Sovi AI
Photo-based solutions with guided steps
Explore more problems and detailed explanations
The predicted egg production in 2000 is 64.45 billion. The result is 5.25 billion eggs less than the actual figure (Option A: The result is 5.25 billion eggs less than the actual figure).