QUESTION IMAGE
Question
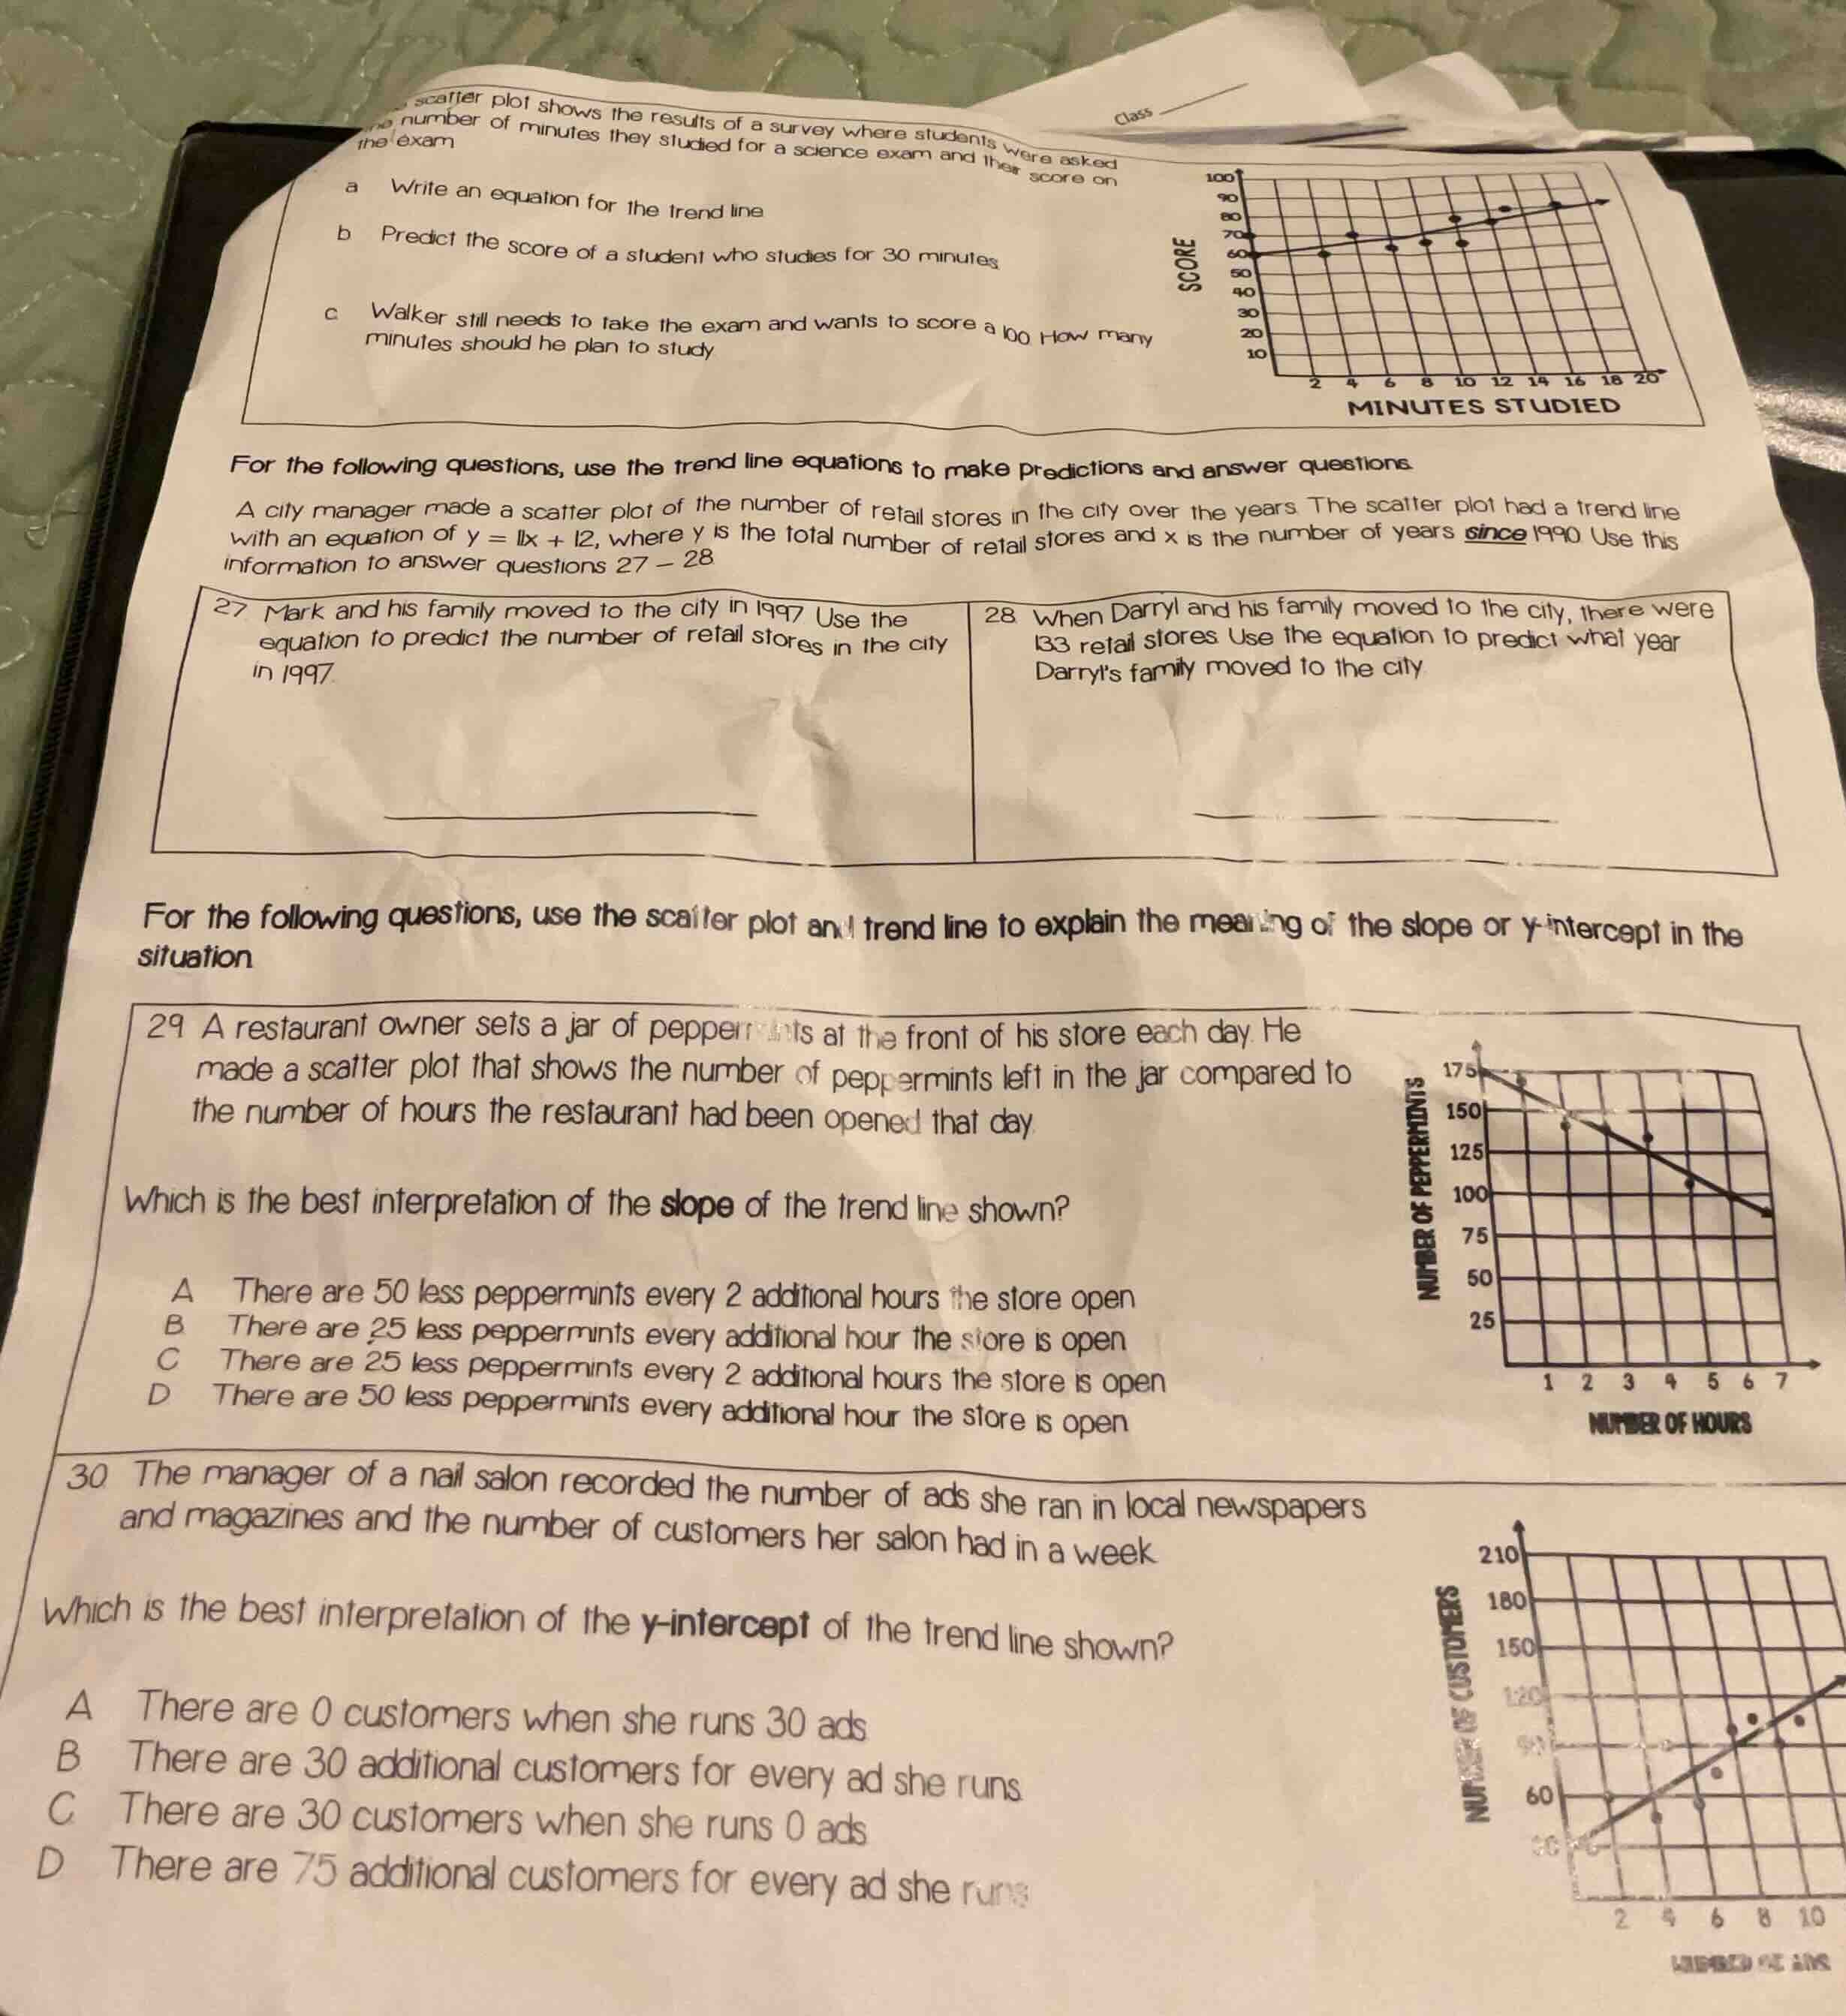
class scatter plot shows the results of a survey where students were asked the number of minutes they studied for a science exam and their score on the exam
a write an equation for the trend line
b predict the score of a student who studies for 30 minutes
c walker still needs to take the exam and wants to score a 100 how many minutes should he plan to study
for the following questions, use the trend line equations to make predictions and answer questions.
a city manager made a scatter plot of the number of retail stores in the city over the years the scatter plot had a trend line with an equation of ( y = 1x + 12 ), where ( y ) is the total number of retail stores and ( x ) is the number of years since 1990 use this information to answer questions 27 – 28
27 mark and his family moved to the city in 1997 use the equation to predict the number of retail stores in the city in 1997.
28 when darryl and his family moved to the city, there were 133 retail stores use the equation to predict what year darryls family moved to the city
for the following questions, use the scatter plot and trend line to explain the meaning of the slope or y-intercept in the situation
29 a restaurant owner sets a jar of peppermints at the front of his store each day. he made a scatter plot that shows the number of peppermints left in the jar compared to the number of hours the restaurant had been opened that day.
which is the best interpretation of the slope of the trend line shown?
a there are 50 less peppermints every 2 additional hours the store open
b there are 25 less peppermints every additional hour the store is open
c there are 25 less peppermints every 2 additional hours the store is open
d there are 50 less peppermints every additional hour the store is open
30 the manager of a nail salon recorded the number of ads she ran in local newspapers and magazines and the number of customers her salon had in a week.
which is the best interpretation of the y-intercept of the trend line shown?
a there are 0 customers when she runs 30 ads
b there are 30 additional customers for every ad she runs
c there are 30 customers when she runs 0 ads
d there are 75 additional customers for every ad she runs
---
Part 1 (Student Exam Score Questions)
Step1: Identify trend line points
Choose two points on the trend line: $(0, 60)$ and $(10, 70)$
Step2: Calculate slope
Slope $m = \frac{y_2-y_1}{x_2-x_1} = \frac{70-60}{10-0} = 1$
Step3: Write trend line equation
Y-intercept $b=60$, so $y = mx + b = x + 60$
Step4: Predict 30-minute study score
Substitute $x=30$ into $y=x+60$:
$y = 30 + 60 = 90$
Step5: Find time for score 100
Substitute $y=100$ into $y=x+60$:
$100 = x + 60 \implies x = 100 - 60 = 40$
---
Part 2 (Retail Store Questions)
Step6: Calculate x for 1997
$x = 1997 - 1990 = 7$
Step7: Predict 1997 store count
Substitute $x=7$ into $y=11x+12$:
$y = 11(7) + 12 = 77 + 12 = 89$
Step8: Solve for x when y=133
Substitute $y=133$ into $y=11x+12$:
$133 = 11x + 12 \implies 11x = 133 - 12 = 121 \implies x = \frac{121}{11} = 11$
Step9: Find year from x=11
Year $= 1990 + 11 = 2001$
---
Part 3 (Peppermint Slope Question)
Step10: Calculate peppermint slope
Use points $(0,175)$ and $(2,125)$:
$m = \frac{125-175}{2-0} = \frac{-50}{2} = -25$
This means 25 fewer peppermints per hour.
---
Part 4 (Nail Salon Y-Intercept Question)
Step11: Identify y-intercept meaning
The y-intercept is where $x=0$ (0 ads), and the trend line crosses $y=30$, so 30 customers with 0 ads.
---

Snap & solve any problem in the app
Get step-by-step solutions on Sovi AI
Photo-based solutions with guided steps
Explore more problems and detailed explanations
- a. $y = x + 60$
b. 90
c. 40 minutes
- 27. 89 retail stores
- 2001
- 29. B. There are 25 less peppermints every additional hour the store is open
- 30. C. There are 30 customers when she runs 0 ads