QUESTION IMAGE
Question
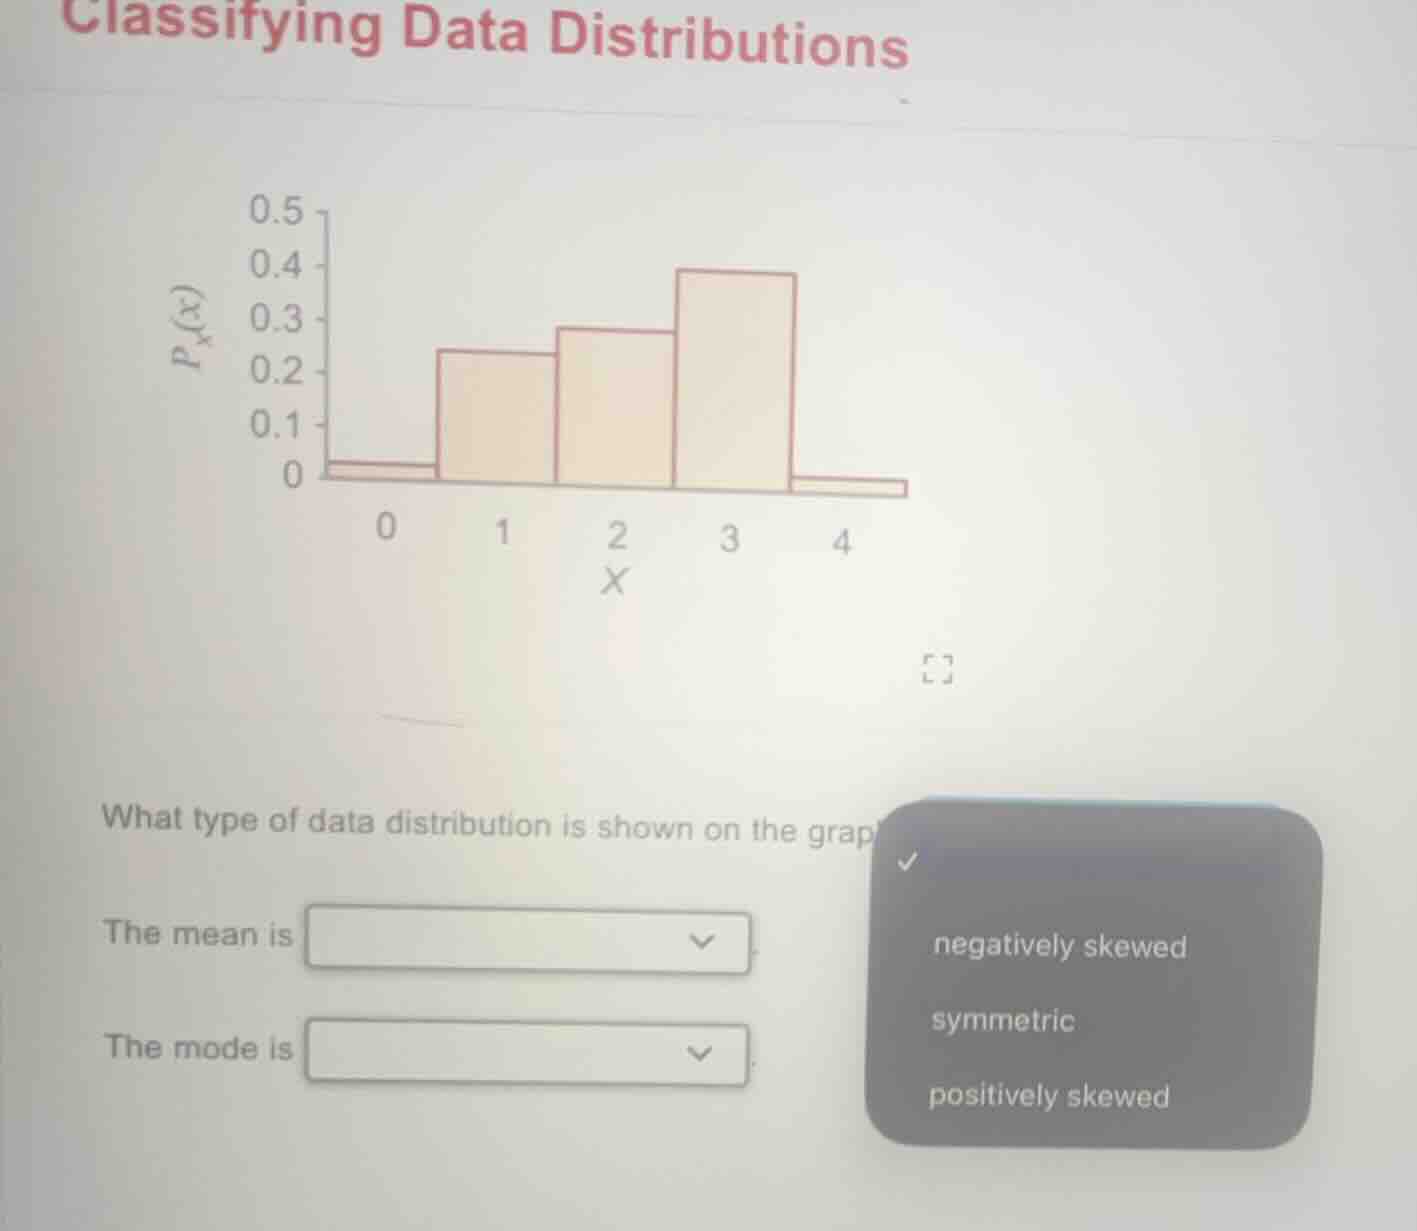
classifying data distributions
what type of data distribution is shown on the graph?
the mean is dropdown
the mode is dropdown
options: negatively skewed, symmetric, positively skewed
Step1: Analyze Skewness
A negatively skewed distribution has a longer tail on the left (lower values), a positively skewed has a longer tail on the right (higher values), and symmetric is balanced. Here, the tail on the left (x=0) is shorter, tail on the right (x=4) is longer? Wait, no—wait, the bars: x=0 has a small bar, x=1,2,3 increase, x=4 small. Wait, actually, the left tail (x < peak) is shorter, right tail (x > peak) is longer? Wait, no, peak is at x=3. So values to the left of peak (x=0,1,2) have increasing frequency, values to the right (x=4) have low frequency. Wait, no—negatively skewed is tail on left (mean < median < mode), positively skewed is tail on right (mode < median < mean). Wait, let's check the graph: the bar heights: x=0: very low, x=1: moderate, x=2: higher, x=3: highest, x=4: very low. So the distribution has a longer tail on the left? No, x=0 is left, but its bar is low. Wait, no—wait, the tail is the part with low frequency. So the left tail (x=0) is short, right tail (x=4) is short? Wait, no, maybe I missee. Wait, the graph: x=0 has a tiny bar, x=1,2,3 have increasing bars, x=4 tiny. So the distribution is skewed left? Wait, no—negatively skewed is tail on left (mean < median < mode), positively on right (mode < median < mean). Wait, the mode is at x=3 (highest bar). The median: let's assume probabilities. Let's say x=0: p≈0.05, x=1: 0.25, x=2: 0.3, x=3: 0.4, x=4: 0.05. Total: 0.05+0.25=0.3, +0.3=0.6, +0.4=1.0, +0.05=1.05? Wait, maybe approximate. The mode is 3. The median: middle value. Let's order the data: most data is at 1,2,3. The median would be around 2-3. The mean: (00.05 + 10.25 + 20.3 + 30.4 + 4*0.05) = 0 + 0.25 + 0.6 + 1.2 + 0.2 = 2.25. Mode is 3. So mean (2.25) < median (let's say 2.5) < mode (3). So that's negatively skewed? Wait, no—negatively skewed is mean < median < mode. Wait, but the tail: the left tail (x=0) is short, right tail (x=4) is short. Wait, maybe the graph is negatively skewed? Wait, no, maybe I got it wrong. Wait, the options are negatively skewed, symmetric, positively skewed. Wait, the bars: x=0 (left) has a small bar, x=1,2,3 increase, x=4 (right) small. So the distribution is skewed to the left (negative skewness) because the left tail is longer? Wait, no, x=0's bar is small, but x=1,2,3 are increasing. Wait, maybe the graph is negatively skewed? Wait, no—let's recall: in a negatively skewed distribution, the mean is less than the median, which is less than the mode. The mode is at the highest bar (x=3). The mean would be pulled left by the low x=0? Wait, x=0 is low, but its probability is low. Wait, maybe the graph is actually negatively skewed? Wait, no, maybe I made a mistake. Wait, the correct answer for the distribution type: looking at the graph, the tail on the left (x=0) is short, tail on the right (x=4) is short, but the bars increase from x=0 to x=3, then decrease. Wait, that's a left-skewed (negatively skewed) distribution? Wait, no, left-skewed has tail on left, right-skewed tail on right. Wait, the bar at x=0 is very small, x=1,2,3 get bigger, x=4 small. So the left tail (x < 3) is increasing, right tail (x > 3) is decreasing. Wait, maybe it's negatively skewed. Then, for the mean: in negative skew, mean < median < mode. So mean is less than mode. Mode is 3 (highest bar). So mean is less than mode. Then, the mode is 3 (the highest bar, at x=3).
Step2: Determine Distribution Type
The distribution has a longer tail on the left (x=0) or right? Wait, no—x=0's bar is small, but x=1,2,3 are increasing. So the tail is on the left (x=0) because that's the…

Snap & solve any problem in the app
Get step-by-step solutions on Sovi AI
Photo-based solutions with guided steps
Explore more problems and detailed explanations
Distribution type: negatively skewed
The mean is less than the mode
The mode is 3
(Assuming the dropdowns: for "The mean is", options like "less than the mode", "equal to the mode", "greater than the mode"; for "The mode is", "3" (or corresponding value). But based on the graph, mode is at x=3, mean is less than mode, distribution is negatively skewed.)