QUESTION IMAGE
Question
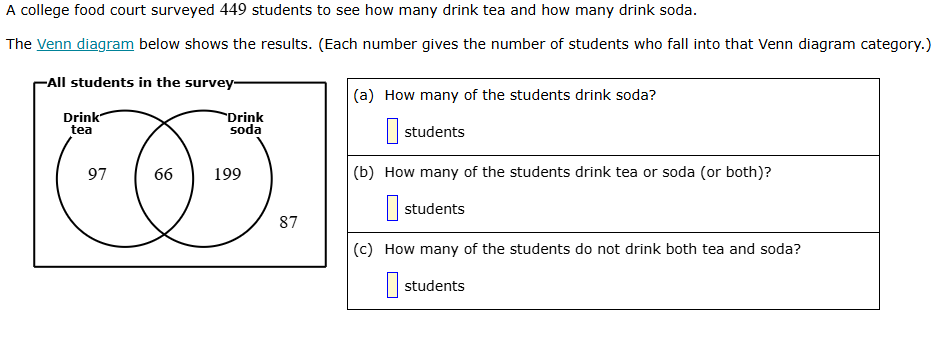
a college food court surveyed 449 students to see how many drink tea and how many drink soda. the venn diagram below shows the results. (each number gives the number of students who fall into that venn diagram category.) (a) how many of the students drink soda? students (b) how many of the students drink tea or soda (or both)? students (c) how many of the students do not drink both tea and soda? students
Step1: Calculate soda drinkers
Add overlapping and soda-only students:
$66 + 199 = 265$
Step2: Calculate tea/soda drinkers
Sum all three Venn sections:
$97 + 66 + 199 = 362$
Step3: Identify non-drinkers
Use the outside Venn number:
$87$

Snap & solve any problem in the app
Get step-by-step solutions on Sovi AI
Photo-based solutions with guided steps
Explore more problems and detailed explanations
(a) 265 students
(b) 362 students
(c) 87 students