QUESTION IMAGE
Question
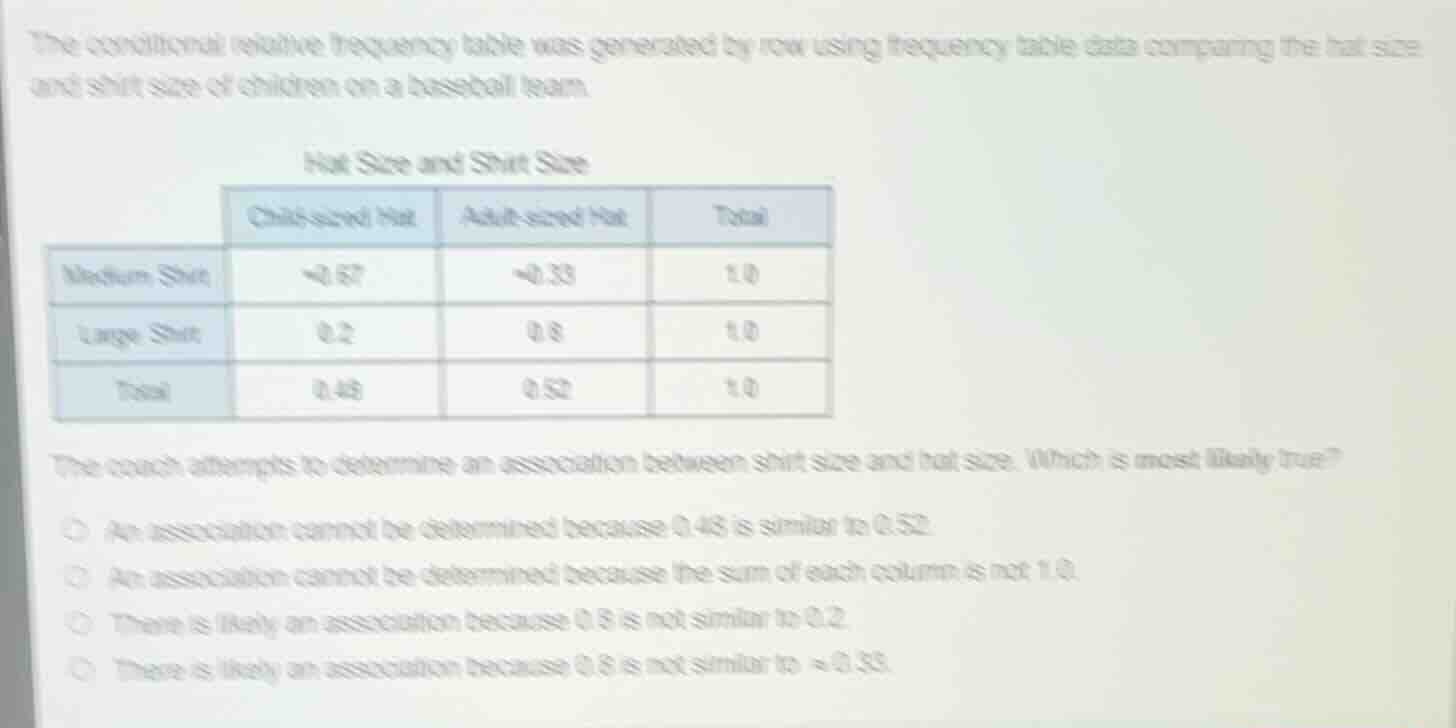
the conditional relative frequency table was generated by row using frequency table data comparing the hat size and shirt size of children on a baseball team.
hat size and shirt size
| child - sized hat | adult - sized hat | total | |
|---|---|---|---|
| large shirt | 0.2 | 0.8 | 1.0 |
| total | 0.48 | 0.52 | 1.0 |
the coach attempts to determine an association between shirt size and hat size. which is most likely true?
○ an association cannot be determined because 0.48 is similar to 0.52.
○ an association cannot be determined because the sum of each column is not 1.0.
○ there is likely an association because 0.8 is not similar to 0.2.
○ there is likely an association because 0.8 is not similar to ≈0.33.
To determine an association between shirt size and hat size using a conditional relative frequency table (generated by row), we compare the conditional relative frequencies within each row (shirt size group) for different hat sizes.
- For "Medium Shirt": Child - sized hat ≈ 0.67, Adult - sized hat ≈ 0.33 (relatively close).
- For "Large Shirt": Child - sized hat = 0.2, Adult - sized hat = 0.8 (not close).
When the conditional relative frequencies within different rows (for the same column categories) differ significantly, it suggests an association. The difference between 0.8 and 0.2 (in the "Large Shirt" row for hat sizes) is notable, indicating a likely association.
Now let's analyze the options:
- Option 1: Comparing total column frequencies (0.48 and 0.52) is not relevant for row - generated conditional relative frequency association testing. Eliminate.
- Option 2: The table is generated by row, so we expect row sums to be 1.0 (which they are), column sums don't need to be 1.0 for row - based analysis. Eliminate.
- Option 3: In the "Large Shirt" row, the frequencies for child - sized (0.2) and adult - sized (0.8) hats are not similar. This difference suggests that shirt size (large vs medium) is associated with hat size, as the likelihood of having an adult - sized hat is much higher for large shirts (0.8) than for medium shirts (≈0.33) and the likelihood of having a child - sized hat is much lower for large shirts (0.2) than for medium shirts (≈0.67). This option correctly identifies the reason for the association.
- Option 4: Comparing 0.8 (from "Large Shirt" - adult) and ≈0.33 (from "Medium Shirt" - adult) is not the right way. We should compare within the same row's hat size frequencies or across rows for the same hat size. Eliminate.

Snap & solve any problem in the app
Get step-by-step solutions on Sovi AI
Photo-based solutions with guided steps
Explore more problems and detailed explanations
C. There is likely an association because 0.8 is not similar to 0.2.