QUESTION IMAGE
Question
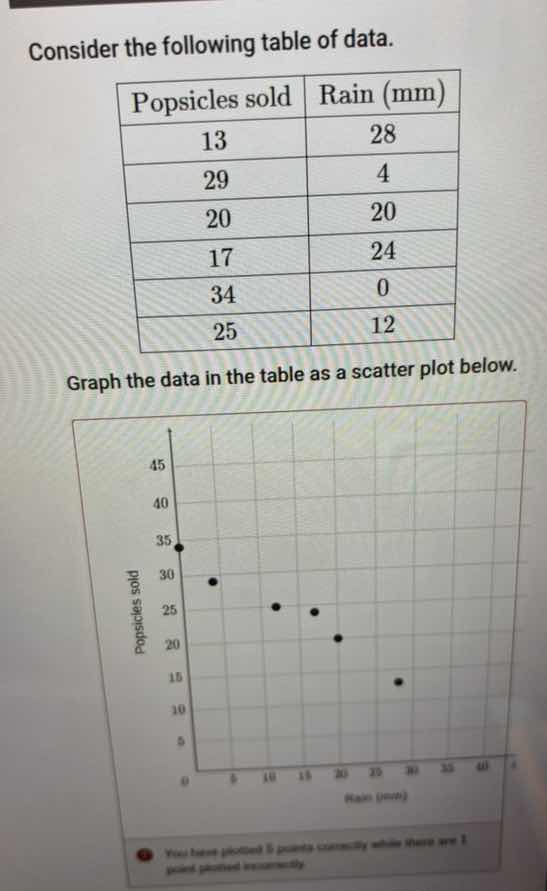
consider the following table of data.
popsicles sold rain (mm)
13 28
29 4
20 20
17 24
34 0
25 12
graph the data in the table as a scatter plot below.
you have plotted 5 points correctly while there are 1 point plotted incorrectly.
Step1: Match data to coordinates
Each pair is (Rain, Popsicles sold):
(28,13), (4,29), (20,20), (24,17), (0,34), (12,25)
Step2: Plot each coordinate
- For (0,34): x=0, y=34 (matches the top-left point)
- For (4,29): x=4, y=29 (matches the second top point)
- For (12,25): x=12, y=25 (matches the third point)
- For (20,20): x=20, y=20 (matches the fourth point)
- For (24,17): x=24, y=17 (matches the fifth point)
- For (28,13): x=28, y=13 (the missing/unplotted point)

Snap & solve any problem in the app
Get step-by-step solutions on Sovi AI
Photo-based solutions with guided steps
Explore more problems and detailed explanations
The correctly completed scatter plot will have the following 6 points plotted:
- (0, 34)
- (4, 29)
- (12, 25)
- (20, 20)
- (24, 17)
- (28, 13)
The error in the given plot is that the point (28, 13) was not plotted, and any incorrectly placed points should be adjusted to match the coordinates above.