QUESTION IMAGE
Question
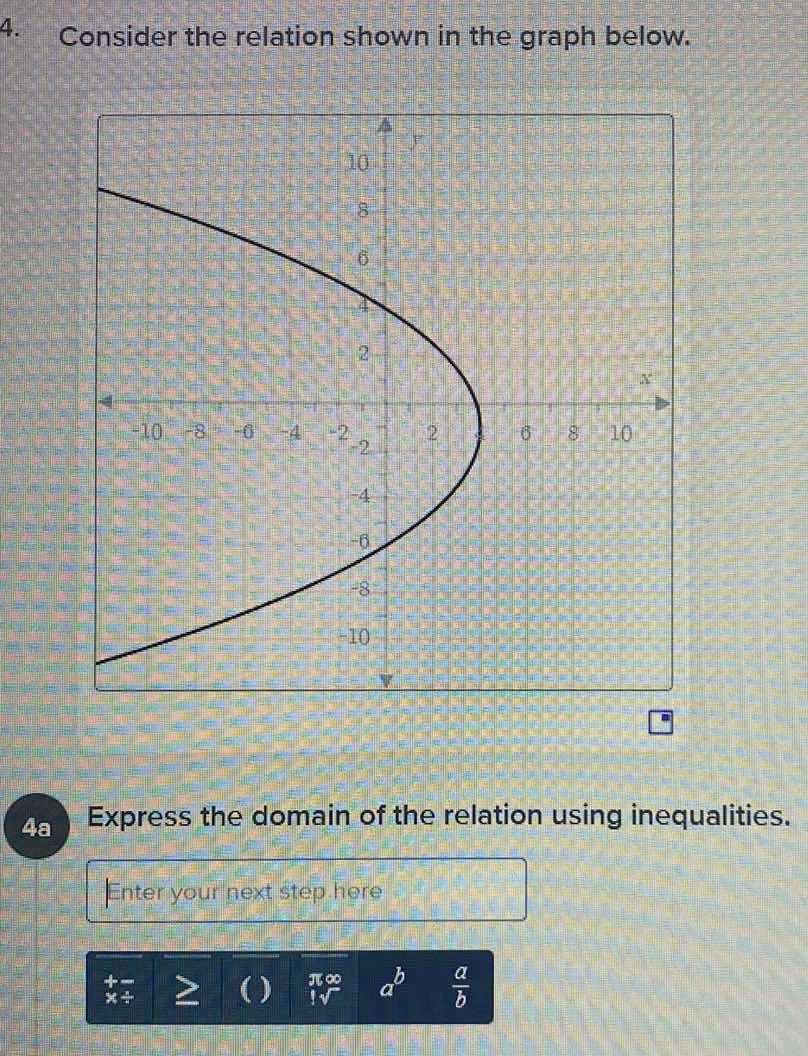
- consider the relation shown in the graph below.
graph of a relation with x-axis from -10 to 10 and y-axis from -10 to 10, the curve is a horizontal parabola opening to the left, with vertex at (4, 0) (approximate) and passing through other points
4a express the domain of the relation using inequalities.
input box and math symbols buttons
Step1: Identify the domain
The domain of a relation is the set of all x - values for which the relation is defined. Looking at the graph, the curve extends from \(x = -\infty\) (or as far left as possible) up to \(x = 4\) (the right - most point of the graph). Wait, no, looking at the graph again, the right - most point is at \(x = 4\)? Wait, no, the graph seems to have a right - most point at \(x = 4\)? Wait, no, let's check the x - axis. The graph is a curve that has its right - most point at \(x = 4\)? Wait, no, the x - coordinate of the right - most point: looking at the graph, the curve ends at \(x = 4\)? Wait, no, the graph in the picture: the right - most point is at \(x = 4\)? Wait, no, let's re - examine. The graph is a sort of parabola - like curve opening to the left? Wait, no, the x - values: the left - hand side goes to negative infinity, and the right - hand side has a maximum x - value. Wait, looking at the graph, the right - most point is at \(x = 4\)? Wait, no, the x - axis labels: - 10, - 8, - 6, - 4, - 2, 0, 2, 4, 6, 8, 10. The curve's right - most point is at \(x = 4\)? Wait, no, the graph shows that the right - most point is at \(x = 4\)? Wait, no, maybe I made a mistake. Wait, the graph: the curve is symmetric? No, looking at the y - axis, when x = 0, y ranges from - 6 to 4? Wait, no, the key is to find the range of x - values. The domain is the set of all x such that the relation has a corresponding y. From the graph, the x - values start from negative infinity (as the left - hand side of the curve goes to the left without bound) and go up to \(x = 4\) (the right - most point of the curve). Wait, no, maybe the right - most point is at \(x = 4\)? Wait, no, let's check again. The graph: the right - most point is at \(x = 4\)? Wait, no, the x - coordinate of the right - most point is 4? Wait, no, the graph's right - most point is at x = 4? Wait, maybe I misread. Wait, the graph is a relation where the x - values are from \(x\leq4\)? Wait, no, looking at the graph, the curve is on the left side of \(x = 4\), so the domain is all real numbers x such that \(x\leq4\).
Step2: Write the inequality
The domain of the relation, in terms of an inequality, is \(x\leq4\).

Snap & solve any problem in the app
Get step-by-step solutions on Sovi AI
Photo-based solutions with guided steps
Explore more problems and detailed explanations
\(x\leq4\)