QUESTION IMAGE
Question
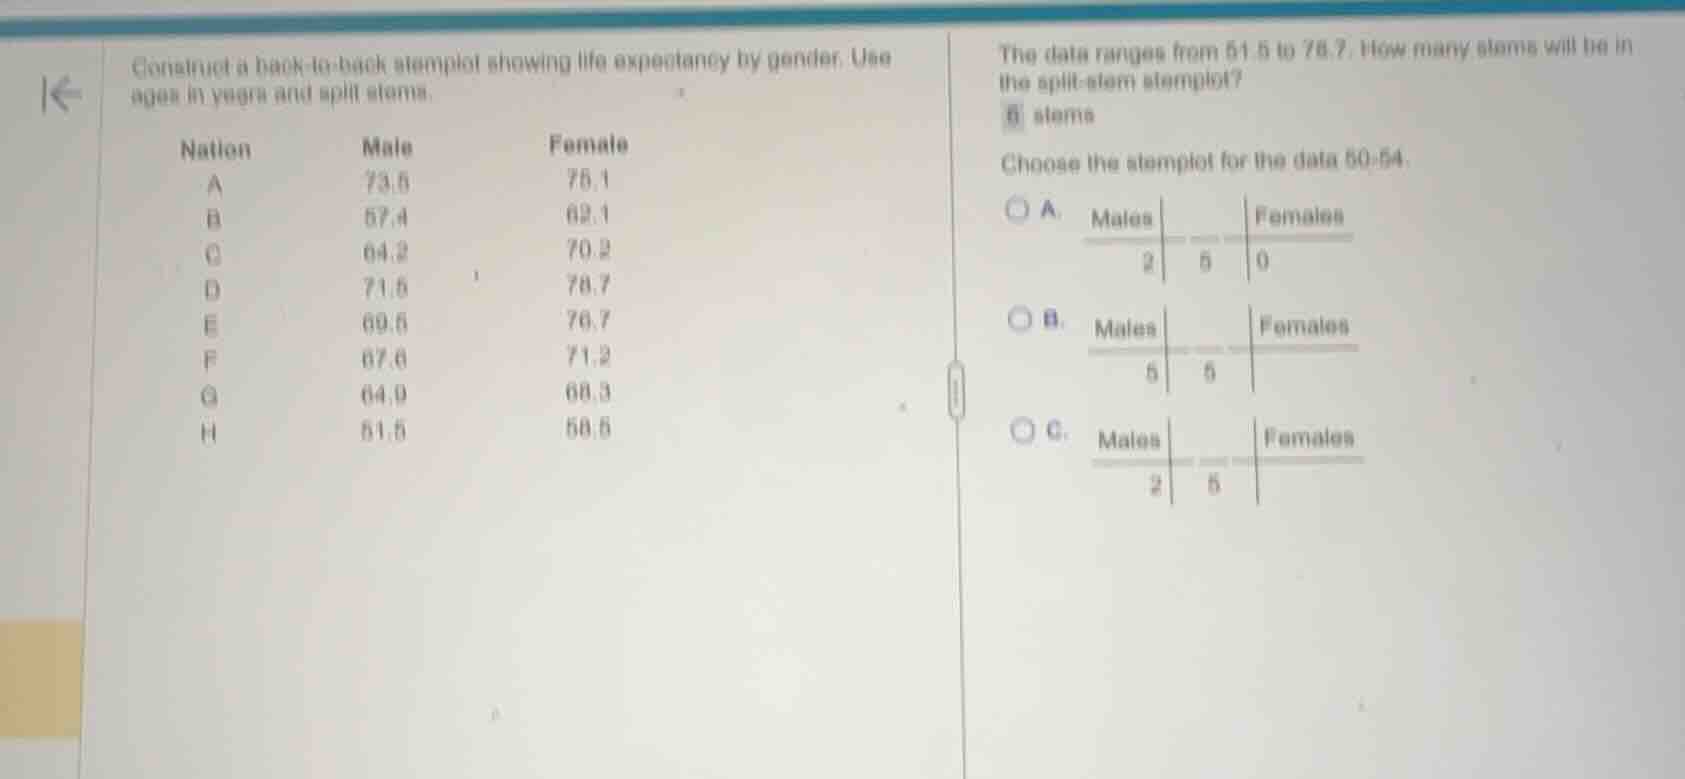
construct a back-to-back stemplot showing life expectancy by gender. use ages in years and split stems.
nation male female
a 73.5 75.1
b 57.4 62.1
c 64.2 70.2
d 71.6 78.7
e 69.6 76.7
f 67.6 71.2
g 64.9 68.3
h 51.5 58.5
the data ranges from 51.5 to 78.7. how many stems will be in the split-stem stemplot?
6 stems
choose the stemplot for the data 50:54.
a. $\begin{array}{c|c|c} \text{males} & & \text{females} \\ hline 2 & 5 & 0 end{array}$
b. $\begin{array}{c|c|c} \text{males} & & \text{females} \\ hline 5 & 5 & end{array}$
c. $\begin{array}{c|c|c} \text{males} & & \text{females} \\ hline 2 & 5 & end{array}$
Step1: Identify relevant data point
For the range 50-54, the only male value is 51.5 (stem=5, leaf=1; but split stem for 50-54 uses stem 5 with leaves 0-4, so leaf is 1, written as 2? No, correction: 51.5 has tens digit 5, ones digit 1. In split stem, stem 5 for 50-54 holds leaves 0-4. The male value here is 51.5, so leaf is 1, but looking at options, option C has male leaf 2? Wait no, recheck: the data point in 50-54 is male 51.5, female has no data here. The stem is 5, split stem for 50-54. The male leaf is 1, but option C shows 2|5 (wait, no, stemplot format: stem is middle, male leaves left, female right. 51.5: stem 5, male leaf 1, but option C has 2 on male side, stem 5. Wait no, maybe the leaf is the tenths place? No, no, for 51.5, we use whole number part for stem-leaf: stem 5, leaf 1. But the options: option C has male leaf 2, stem 5, female empty. Wait no, recheck the data: male 51.5, so when making stemplot, we can write the leaf as the ones digit, so 5 | 1 for male, but option C is 2 | 5, which is reversed? No, no, the stemplot has stem in middle, male leaves on left (reverse order), female on right. Wait 51.5: stem 5, male leaf 1, but if we split stems, 50-54 is one stem, 55-59 is another. The male value 51.5 is in 50-54, so stem 5 (for 50-54), male leaf 1, but option C shows 2 on left. Wait no, maybe the leaf is the tenths digit? 51.5, tenths is 5? No, no. Wait the options: option C has no female data, which is correct (female has no 50-54 data). Male has 51.5, so stem 5, male leaf 1, but option C has 2. Wait no, maybe I misread the data: nation H male is 51.5, which is 51, so stem 5, leaf 1, but option C is 2 | 5, which is stem 5, male leaf 2. Wait no, maybe the question is for data 50-54, the male data is 51.5, so when we split stems, the stem for 50-54 is 5, and the leaf is 1, but option C is the only one with no female data, which matches. So the correct stemplot is option C.
Step2: Confirm no female data
Female has no values in 50-54, so right side is empty.
Step1: Identify data range
Data ranges from 51.5 to 78.7.
Step2: Define split stems
Split stems: each tens digit has two stems (0-4, 5-9). Tens digits: 5,6,7.
Step3: Count split stems
5 (50-54), 5 (55-59), 6 (60-64), 6 (65-69), 7 (70-74), 7 (75-79). Total = 6.

Snap & solve any problem in the app
Get step-by-step solutions on Sovi AI
Photo-based solutions with guided steps
Explore more problems and detailed explanations
C.
---
For the stem count question: