QUESTION IMAGE
Question
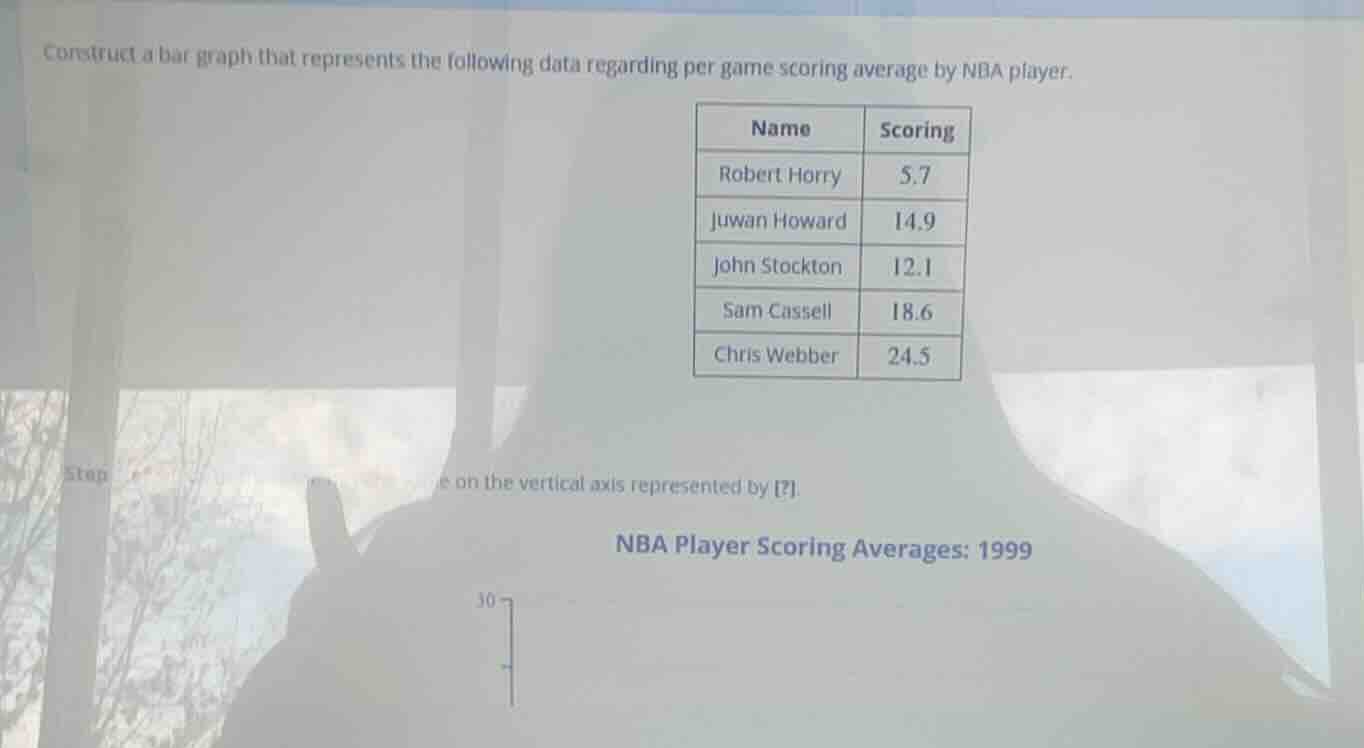
construct a bar graph that represents the following data regarding per game scoring average by nba player.
name | scoring
robert horry | 5.7
juwan howard | 14.9
john stockton | 12.1
sam cassell | 18.6
chris webber | 24.5
step e on the vertical axis represented by ?.
nba player scoring averages: 1999
Step1: Define axes for bar graph
Horizontal axis: List player names (Robert Horry, Juwan Howard, John Stockton, Sam Cassell, Chris Webber).
Vertical axis: Label "Scoring Average (Points per Game)", set scale from 0 to 30 with intervals of 5 (to fit max value 24.5).
Step2: Plot bars for each player
For Robert Horry: Draw bar to height $5.7$
For Juwan Howard: Draw bar to height $14.9$
For John Stockton: Draw bar to height $12.1$
For Sam Cassell: Draw bar to height $18.6$
For Chris Webber: Draw bar to height $24.5$
Step3: Add title and finalize
Add title: "NBA Player Scoring Averages: 1999"

Snap & solve any problem in the app
Get step-by-step solutions on Sovi AI
Photo-based solutions with guided steps
Explore more problems and detailed explanations
A completed bar graph with:
- Horizontal axis: Player names (Robert Horry, Juwan Howard, John Stockton, Sam Cassell, Chris Webber)
- Vertical axis: Scoring Average (0 to 30, 5-point intervals)
- Bars with heights matching each player's score: 5.7, 14.9, 12.1, 18.6, 24.5 respectively
- Title: "NBA Player Scoring Averages: 1999"
(Visual representation summary: Chris Webber has the tallest bar, Robert Horry has the shortest bar, with the others ordered by their scoring values between these two.)