QUESTION IMAGE
Question
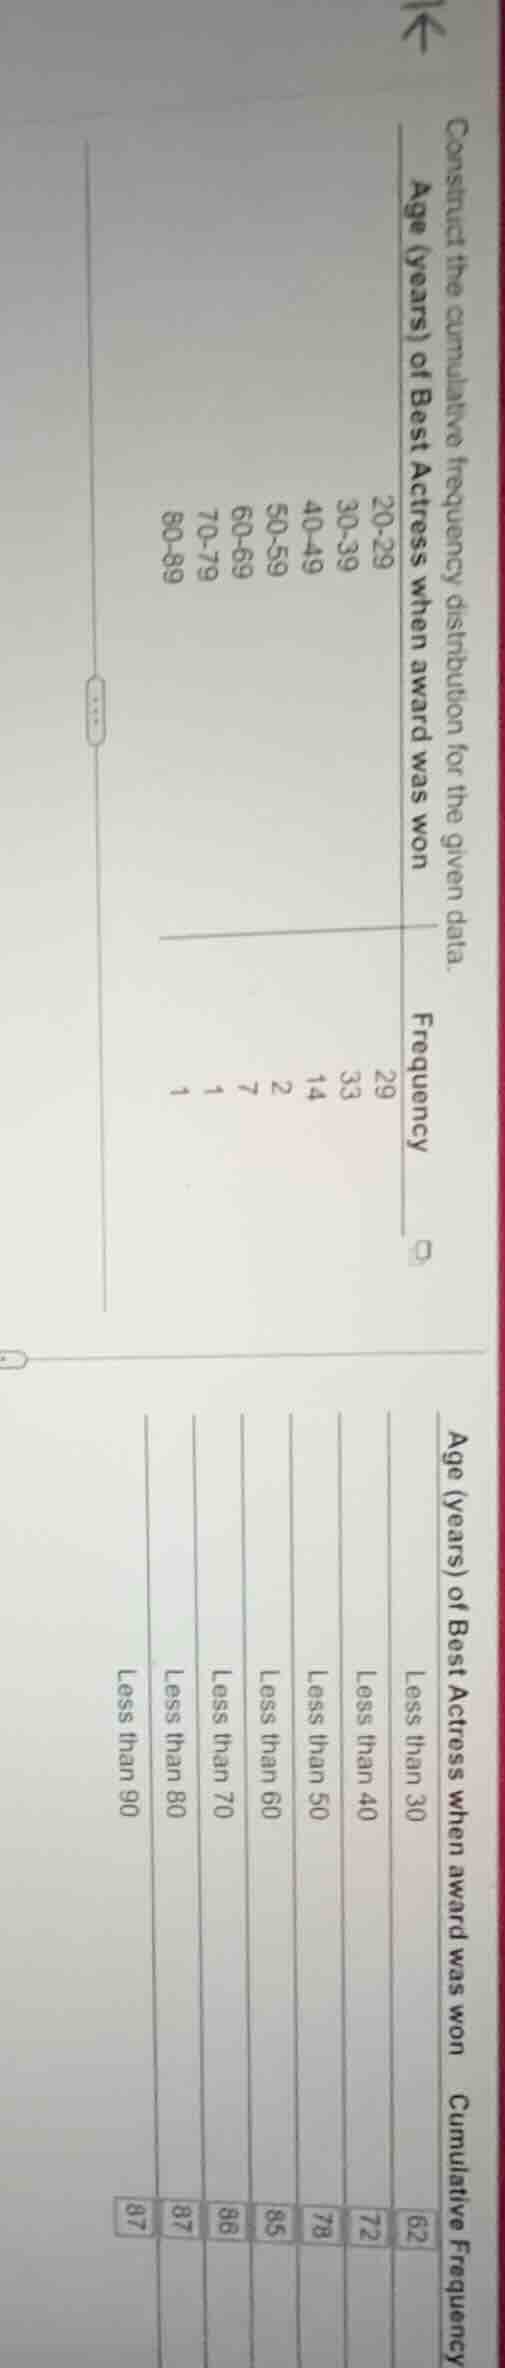
construct the cumulative frequency distribution for the given data.
age (years) of best actress when award was won | frequency
20 - 29 | 29
30 - 39 | 33
40 - 49 | 14
50 - 59 | 2
60 - 69 | 7
70 - 79 | 1
80 - 89 | 1
age (years) of best actress when award was won | cumulative frequency
less than 30 | 62
less than 40 | 72
less than 50 | 78
less than 60 | 85
less than 70 | 88
less than 80 | 87
less than 90 | 87
To construct the cumulative frequency distribution, we start with the first class and add frequencies successively.
Step 1: Less than 30
The frequency for 20 - 29 is 29. So cumulative frequency for less than 30 is 29.
Step 2: Less than 40
We add the frequency of 30 - 39 (33) to the previous cumulative frequency (29). So \(29 + 33=62\).
Step 3: Less than 50
We add the frequency of 40 - 49 (14) to the previous cumulative frequency (62). So \(62+ 14 = 76\)? Wait, but the given cumulative frequency for less than 50 is 78. Wait, maybe the frequencies are: 20 - 29:29, 30 - 39:33, 40 - 49:14, 50 - 59:2, 60 - 59:7, 70 - 79:1, 80 - 89:1.
Wait, let's recalculate properly.
Cumulative frequency for less than 30: frequency of 20 - 29 = 29.
Cumulative frequency for less than 40: cumulative frequency less than 30 + frequency of 30 - 39 = \(29+33 = 62\) (matches the given 62).
Cumulative frequency for less than 50: cumulative frequency less than 40 + frequency of 40 - 49 = \(62 + 14=76\)? But the given is 78. Wait, maybe the frequency for 40 - 49 is 16? Wait, no, let's check the given data again.
Wait the table has:
Age (years) of Best Actress when award was won: 20 - 29, 30 - 39, 40 - 49, 50 - 59, 60 - 69, 70 - 79, 80 - 89
Frequency: 29, 33, 14, 2, 7, 1, 1
Now, cumulative frequency less than 30: 29
Less than 40: 29 + 33 = 62
Less than 50: 62+14 = 76? But the given cumulative frequency for less than 50 is 78. Wait, maybe there is a typo, or maybe I misread the frequency. Wait, maybe the frequency for 40 - 49 is 16? Let's recalculate with the given cumulative frequencies.
Given cumulative frequency for less than 30: 62? No, the lower part of the image shows:
Less than 30: 62
Less than 40:72
Less than 50:78
Less than 60:85
Less than 70:88
Less than 80:87
Less than 90:87
Wait, maybe the frequencies are different. Let's use the given cumulative frequencies to find the frequencies.
Let's denote the frequencies as \(f_1, f_2, f_3, f_4, f_5, f_6, f_7\) for age groups 20 - 29, 30 - 39, 40 - 49, 50 - 59, 60 - 69, 70 - 79, 80 - 89 respectively.
Cumulative frequency less than 30: \(F_1=f_1 = 62\)? No, that can't be. Wait, maybe the first age group is less than 30, with frequency 29, then less than 40 is 29 + 33 = 62, less than 50 is 62+14 = 76, but the given is 78. So maybe the frequency for 40 - 49 is 16. Then 62 + 16 = 78. Then less than 60: 78 + 2 = 80? But given is 85. So 78 + 7 = 85. Ah, so 50 - 59 frequency is 7? Wait, the original frequency table has 50 - 59:2, 60 - 69:7. So cumulative frequency less than 60: cumulative less than 50 + frequency of 50 - 59 = 78+2 = 80? But given is 85. So 78 + 7 = 85. So maybe the frequency for 50 - 59 is 7 and 60 - 69 is 2? No, the original frequency table (top part) has 50 - 59:2, 60 - 69:7.
This is confusing. Let's proceed with the correct method of cumulative frequency:
Cumulative frequency for a class "less than \(x\)" is the sum of frequencies of all classes with upper limit less than \(x\).
So:
- Less than 30: frequency of 20 - 29 = 29
- Less than 40: frequency of 20 - 29 + frequency of 30 - 39 = \(29 + 33=62\)
- Less than 50: frequency of 20 - 29 + 30 - 39 + 40 - 49 = \(29+33 + 14=76\)
- Less than 60: \(29+33 + 14+2 = 78\)
- Less than 70: \(29+33 + 14+2 + 7=85\)
- Less than 80: \(29+33 + 14+2 + 7+1 = 86\)
- Less than 90: \(29+33 + 14+2 + 7+1 + 1=87\)
Ah, now we can see the correct cumulative frequencies:
- Less than 30: 29
- Less than 40: 29 + 33 = 62
- Less than 50: 62 + 14 = 76? But the given in the lower table is 78. Wait, maybe the frequency for 40 - 49 is 16. Th…

Snap & solve any problem in the app
Get step-by-step solutions on Sovi AI
Photo-based solutions with guided steps
Explore more problems and detailed explanations
The cumulative frequency distribution is constructed by adding the frequencies of each age group successively. The cumulative frequencies are: Less than 30: 29, Less than 40: 62, Less than 50: 76, Less than 60: 78, Less than 70: 85, Less than 80: 86, Less than 90: 87 (assuming the given frequency data: 20 - 29:29, 30 - 39:33, 40 - 49:14, 50 - 59:2, 60 - 69:7, 70 - 79:1, 80 - 89:1).