QUESTION IMAGE
Question
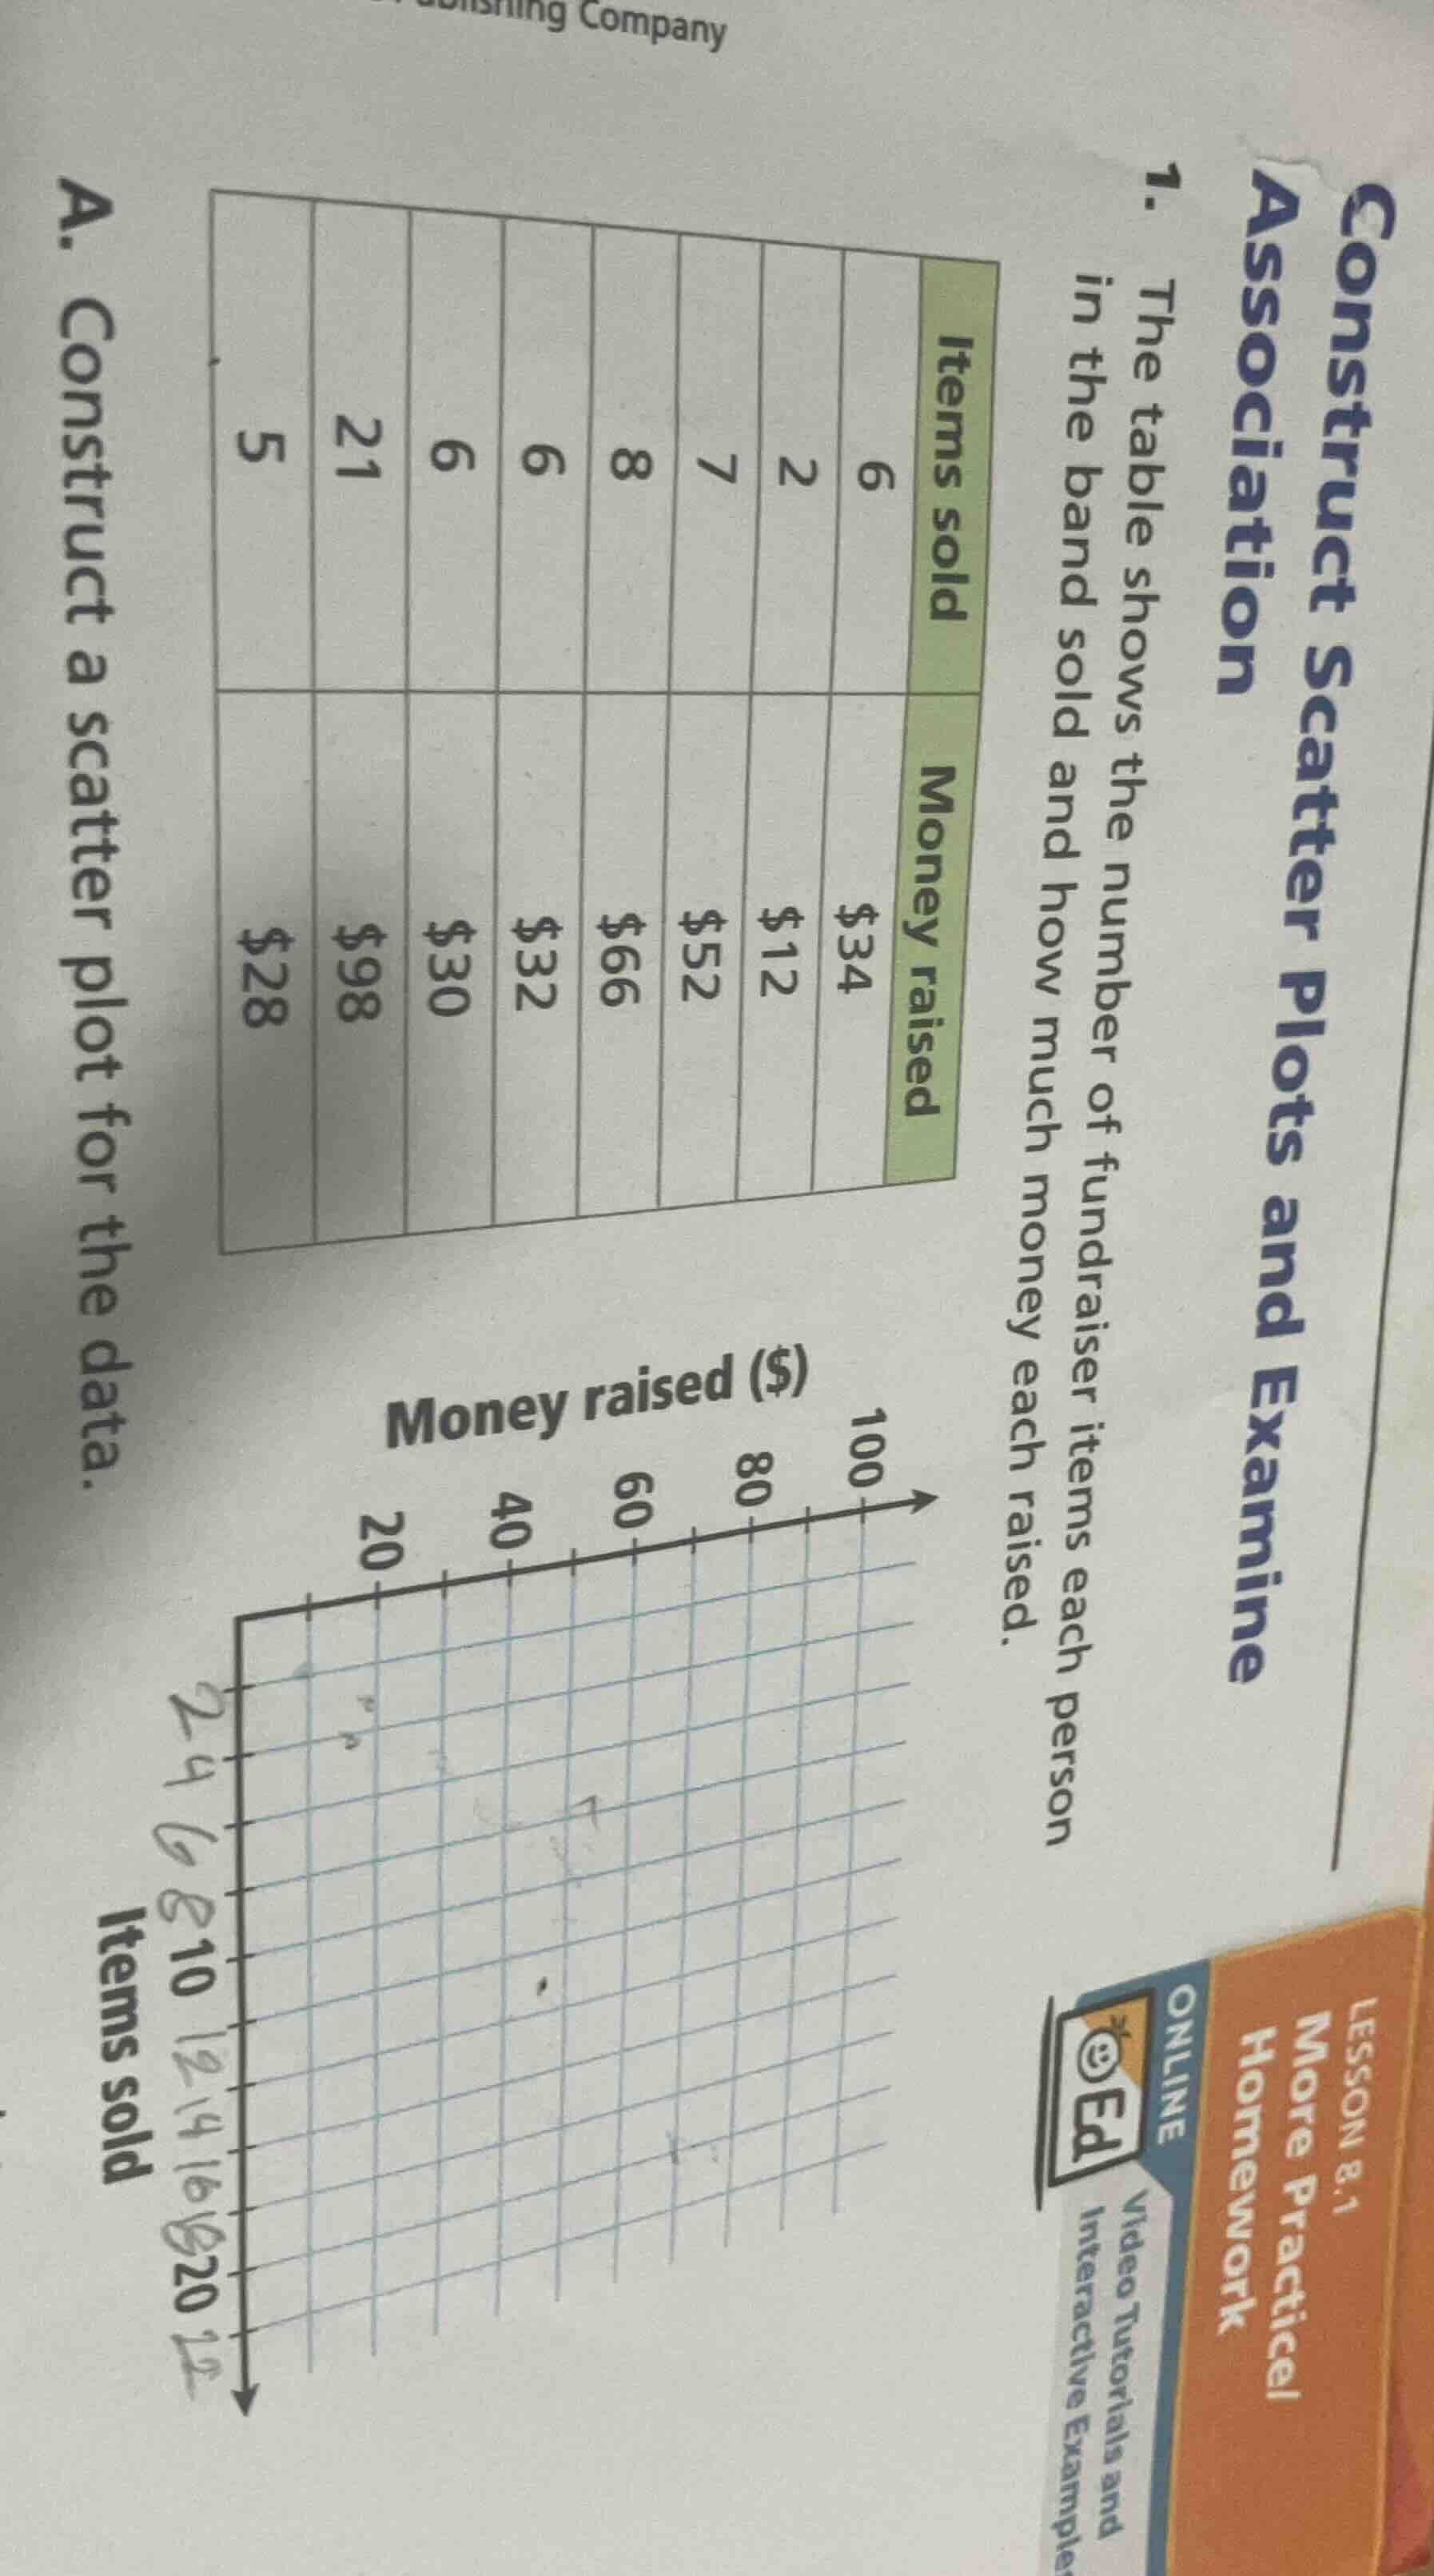
construct scatter plots and examine association
- the table shows the number of fundraiser items each person in the band sold and how much money each raised.
items sold: 6, 2, 7, 8, 6, 6, 21, 5
money raised: $34, $12, $52, $66, $32, $30, $98, $28
a. construct a scatter plot for the data.
(there is a coordinate grid with money raised ($) on the vertical axis from 20 to 100 and items sold on the horizontal axis from 2 to 22, but the specific plotting part is an image and omitted here.)
Step1: Identify data pairs
Each pair is (Items sold, Money raised):
$(6, 34), (2, 12), (7, 52), (8, 66), (6, 32), (6, 30), (21, 98), (5, 28)$
Step2: Plot each data point
- Locate x (items sold) on horizontal axis, y (money raised) on vertical axis, then mark each point:
- $(6, 34)$: x=6, y=34
- $(2, 12)$: x=2, y=12
- $(7, 52)$: x=7, y=52
- $(8, 66)$: x=8, y=66
- $(6, 32)$: x=6, y=32
- $(6, 30)$: x=6, y=30
- $(21, 98)$: x=21, y=98
- $(5, 28)$: x=5, y=28

Snap & solve any problem in the app
Get step-by-step solutions on Sovi AI
Photo-based solutions with guided steps
Explore more problems and detailed explanations
A scatter plot with the following points plotted:
(6, 34), (2, 12), (7, 52), (8, 66), (6, 32), (6, 30), (21, 98), (5, 28)
(Note: When drawn on the provided grid, each point aligns with the corresponding x (Items sold) and y (Money raised) axis values.)