QUESTION IMAGE
Question
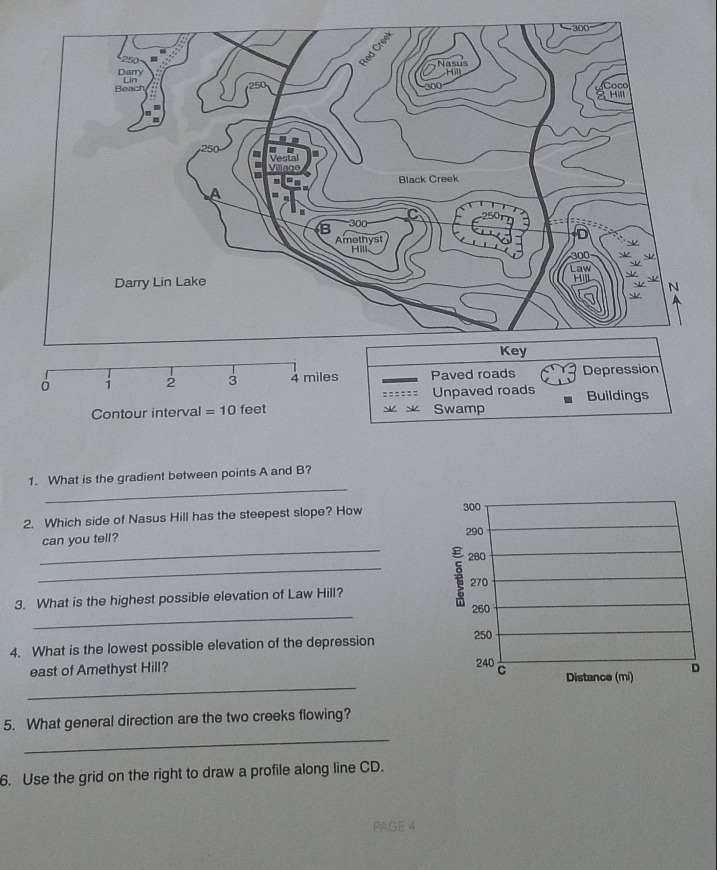
contour interval = 10 feet
key
paved roads
depression
unpaved roads
buildings
swamp
- what is the gradient between points a and b?
- which side of nasus hill has the steepest slope? how can you tell?
- what is the highest possible elevation of law hill?
- what is the lowest possible elevation of the depression east of amethyst hill?
- what general direction are the two creeks flowing?
- use the grid on the right to draw a profile along line cd.
elevation (m)
300
290
280
270
260
250
240
c distance (m) d
max 309).
Question 4: Lowest possible elevation of the depression east of Amethyst Hill
Step1: Identify depression contour
The depression has a dashed contour (depression contour) with 250 feet. Depression contours are lower than the surrounding. The contour interval is 10, so the depression is below 250. The next lower contour (if it were a normal contour) would be 240, but since it's a depression, the lowest elevation is just above 240 (because the depression contour is 250, and each contour is 10, so the depression is between 240 and 250, so lowest possible is 241 feet (just above 240, as it can't be equal to 240 if the 250 is the depression contour, and the interval is 10, so the depression is in the 240 - 250 range, lowest is just above 240, so 241).
Step1: Use contour lines and north arrow
Creeks flow from higher to lower elevation (downhill). Contour lines show elevation (higher elevation is where contours are more concentrated upwards). The north arrow is up. So, looking at the contours, the creeks should flow towards lower elevation, which is generally south or southeast (since the land slopes towards the lake or lower areas, and with the north arrow, downwards on the map would be south - related directions). Alternatively, using the "V" - shape of contours (creeks form "V" pointing upstream), so the "V" of the creek contours points north (upstream), so flow is south (downstream).
Step1: Mark elevations of C and D and intermediate points
- Point C: Find its elevation (e.g., 250? Wait, no, earlier context: Wait, C is on a contour. Let's assume C is on 250, D is on... Wait, the grid has elevation from 240 - 300. First, find the elevation of C: look at the map, C is on a contour. Let's say C is 250, then find the elevation of each point along CD by following the contour lines.
Step2: Plot points on the grid
On the grid (x - axis: distance, y - axis: elevation), mark the elevation of C (e.g., 250), then for each contour crossing CD, mark their elevation (e.g., if CD crosses 250, 260, 270, 280, 290, 300? No, wait, the contour interval is 10. So plot the elevation of C, then as you move from C to D, plot the elevation at each contour intersection, then connect the points with a smooth line.

Snap & solve any problem in the app
Get step-by-step solutions on Sovi AI
Photo-based solutions with guided steps
Explore more problems and detailed explanations
241 feet (between 240 and 250, so lowest possible is just above 240, e.g., 241).