QUESTION IMAGE
Question
on core algebra i b-cr english
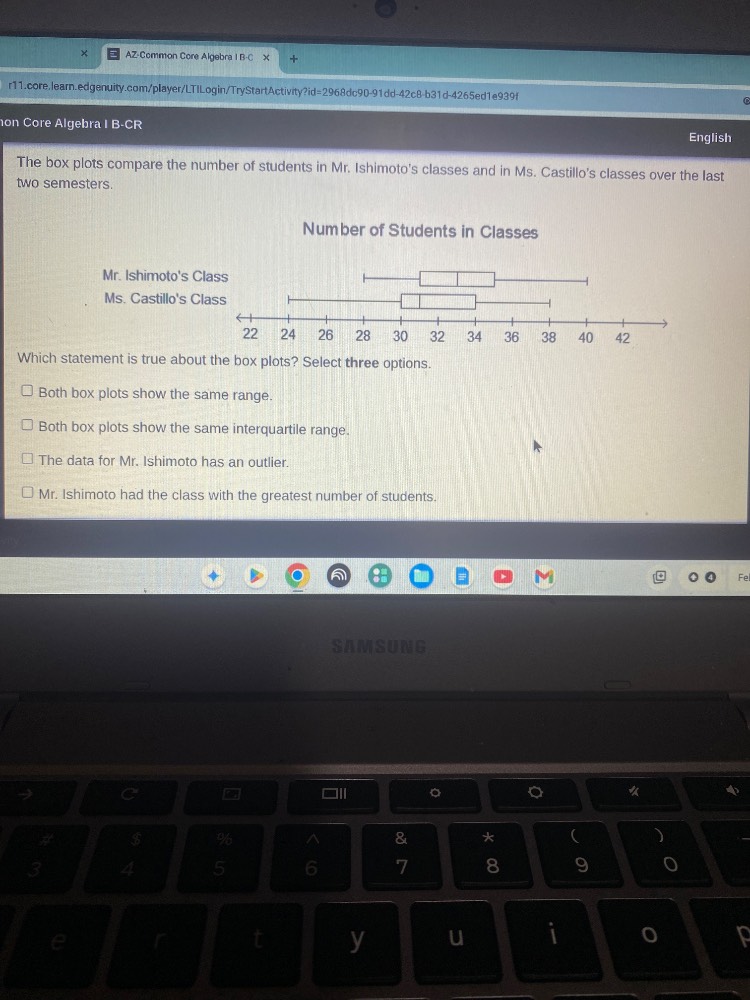
the box plots compare the number of students in mr. ishimotos classes and in ms. castillos classes over the last two semesters.
number of students in classes
mr. ishimotos class
ms. castillos class
which statement is true about the box plots? select three options.
□ both box plots show the same range.
□ both box plots show the same interquartile range.
□ the data for mr. ishimoto has an outlier.
□ mr. ishimoto had the class with the greatest number of students.
Step1: Calculate range for both plots
Mr. Ishimoto's range: $40 - 28 = 12$
Ms. Castillo's range: $36 - 22 = 14$
Step2: Calculate interquartile range (IQR)
Mr. Ishimoto's IQR: $34 - 30 = 4$
Ms. Castillo's IQR: $32 - 28 = 4$
Step3: Check for outliers
Ishimoto's data: $Q1-1.5\times IQR=30-6=24$, $Q3+1.5\times IQR=34+6=40$. All data (28 to 40) are within bounds, no outliers.
Castillo's data: $Q1-1.5\times IQR=28-6=22$, $Q3+1.5\times IQR=32+6=38$. All data (22 to 36) are within bounds.
Step4: Check maximum value
Mr. Ishimoto's max is 40, Castillo's max is 36.

Snap & solve any problem in the app
Get step-by-step solutions on Sovi AI
Photo-based solutions with guided steps
Explore more problems and detailed explanations
- Both box plots show the same interquartile range.
- Mr. Ishimoto had the class with the greatest number of students.