QUESTION IMAGE
Question
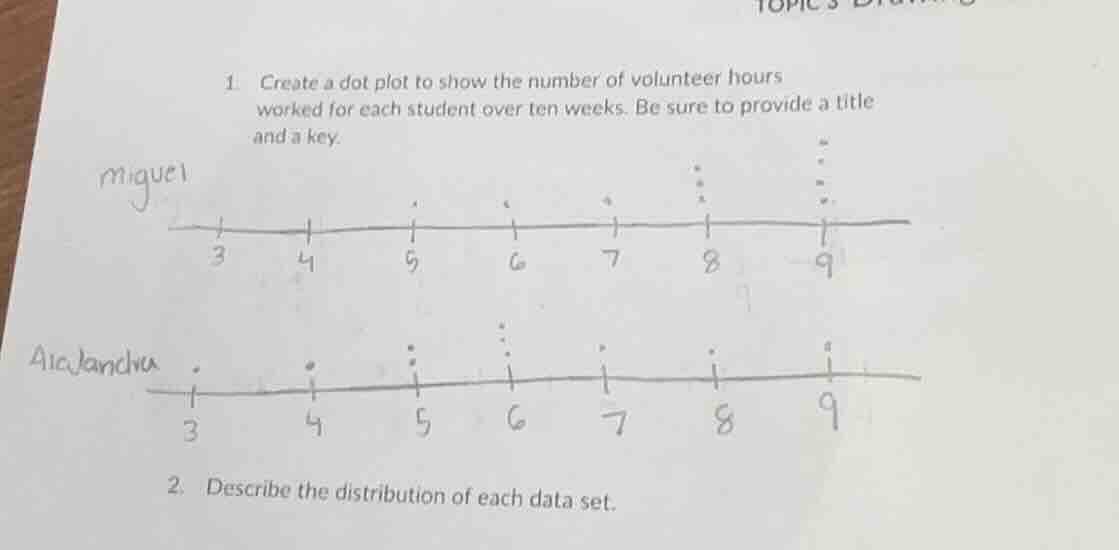
- create a dot plot to show the number of volunteer hours worked for each student over ten weeks. be sure to provide a title and a key.
miguel
3 4 5 6 7 8 9
alexandra
3 4 5 6 7 8 9
- describe the distribution of each data set.
Brief Explanations
First, formalize the dot plots with proper labels, then analyze each data set's shape, center, and spread.
- For the dot plots: Add a clear title, label the horizontal axis, and define the key.
- For distribution descriptions: Assess if data clusters, skews, note the typical value (center) and range of values.

Snap & solve any problem in the app
Get step-by-step solutions on Sovi AI
Photo-based solutions with guided steps
Explore more problems and detailed explanations
- ## Formalized Dot Plots:
Title: Weekly Volunteer Hours (10 Weeks) for Two Students
Key: Each dot = 1 week of volunteer hours
Miguel's Hours:
| Hours | 3 | 4 | 5 | 6 | 7 | 8 | 9 |
|---|
Alejandra's Hours:
| Hours | 3 | 4 | 5 | 6 | 7 | 8 | 9 |
|---|
- ## Distribution Descriptions:
- Miguel's data: Skewed left. Most of his volunteer hours cluster at the higher end (8-9 hours per week), with fewer weeks at lower hour counts (5-7). The center is around 8-9 hours, and his hours range from 5 to 9.
- Alejandra's data: Roughly symmetric. Her hours are evenly spread across 3-9, with a slight cluster at 5-6 hours. The center is around 5-6 hours, and her hours range from 3 to 9.