QUESTION IMAGE
Question
ct the correct location.
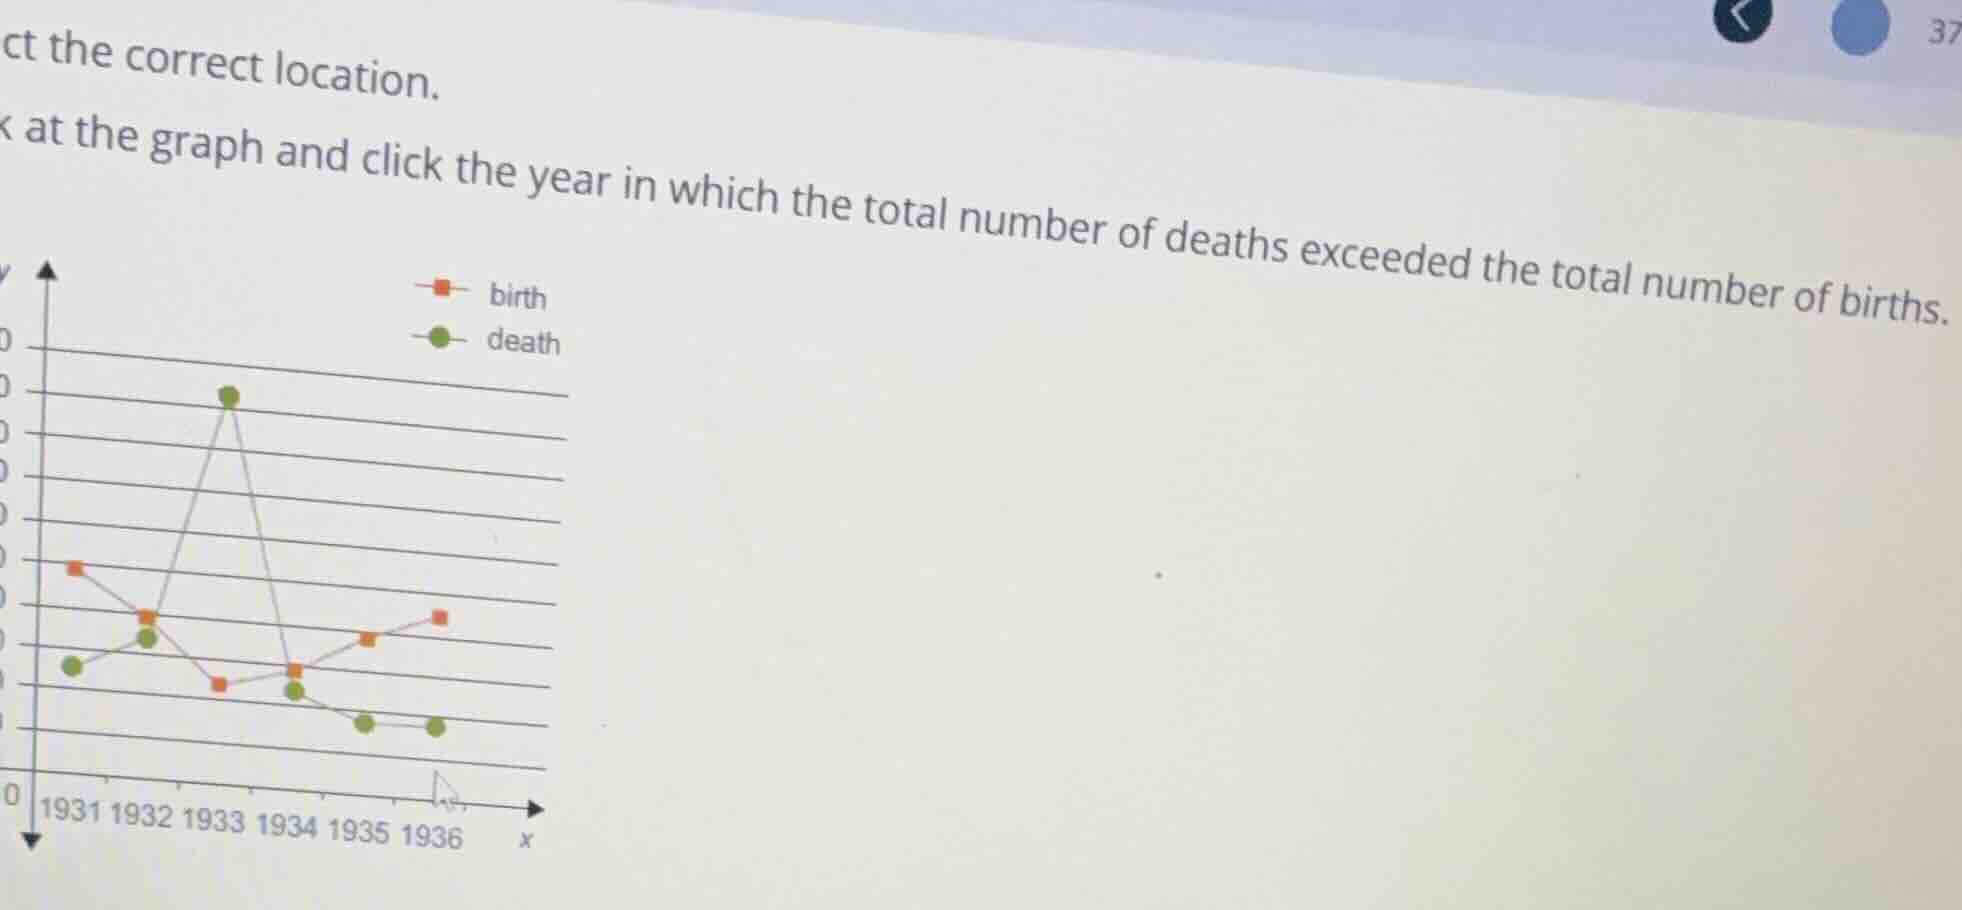
look at the graph and click the year in which the total number of deaths exceeded the total number of births.
Brief Explanations
Compare the birth and death data points for each year on the graph. Identify the year where the death data point is positioned higher than the birth data point, meaning deaths exceed births.

Snap & solve any problem in the app
Get step-by-step solutions on Sovi AI
Photo-based solutions with guided steps
Explore more problems and detailed explanations
1933