QUESTION IMAGE
Question
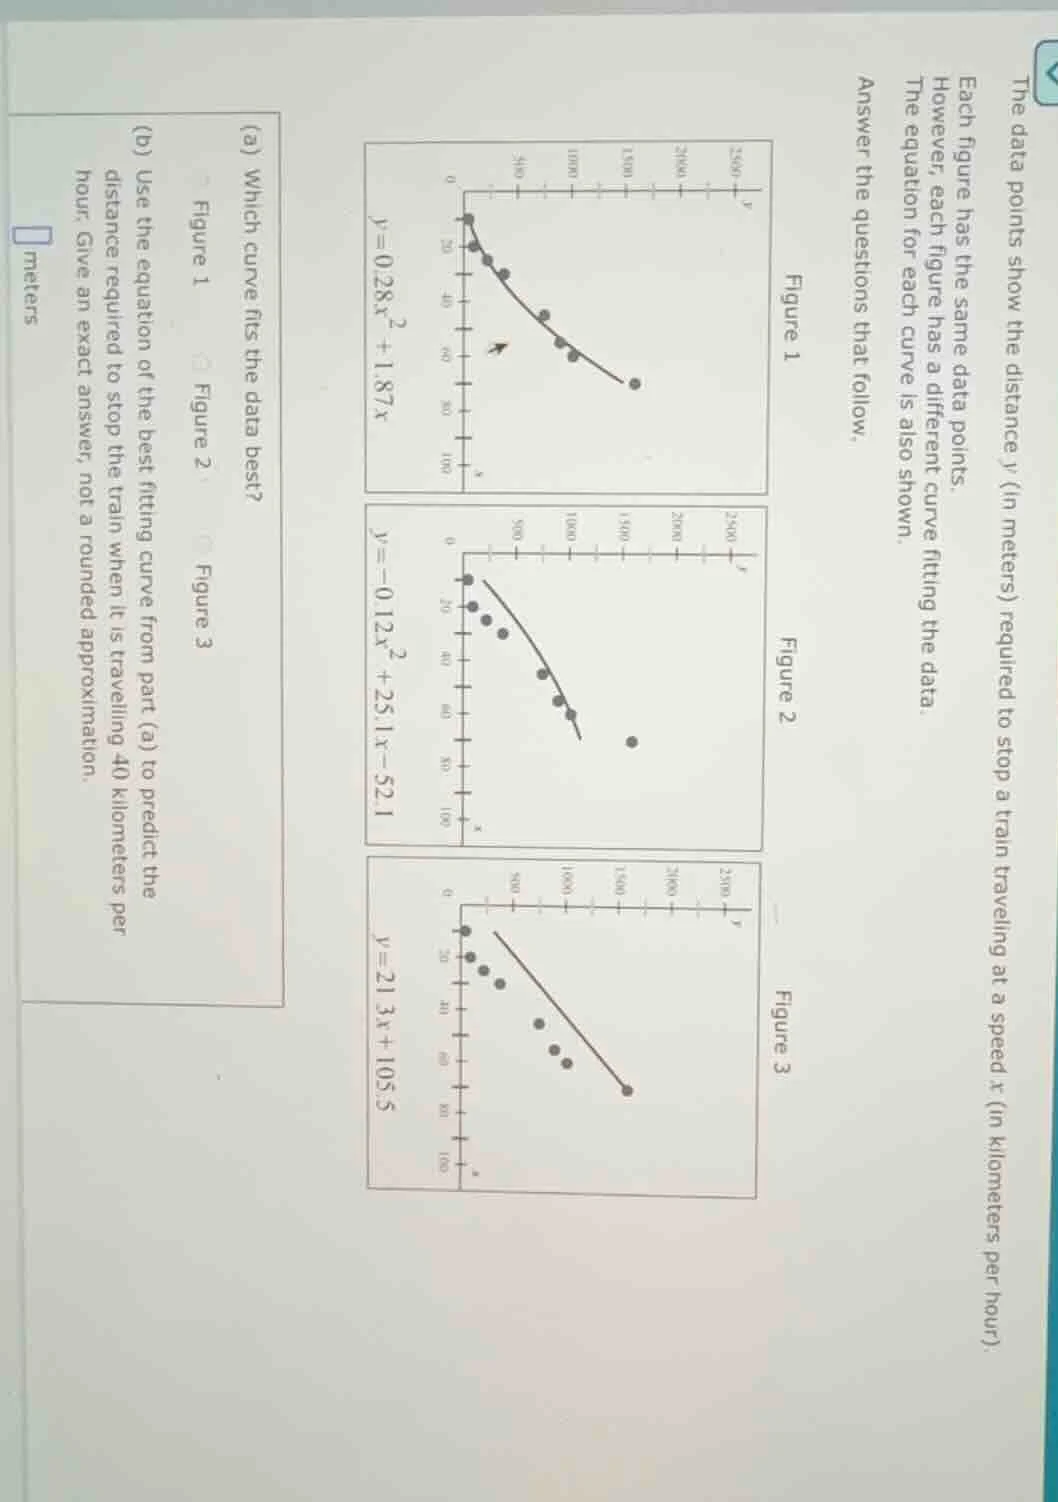
the data points show the distance ( y ) (in meters) required to stop a train traveling at a speed ( x ) (in kilometers per hour). each figure has the same data points. however, each figure has a different curve fitting the data. the equation for each curve is also shown. answer the questions that follow.
figure 1
( y = 0.28x^2 + 18.7x )
figure 2
( y = -0.12x^2 + 25.1x - 52.1 )
figure 3
( y = 21.3x + 105.5 )
(a) which curve fits the data best?
figure 1
figure 2
figure 3
(b) use the equation of the best fitting curve from part (a) to predict the distance required to stop the train when it is travelling 40 kilometers per hour. give an exact answer, not a rounded approximation.
meters
Step1: Identify best fitting curve
Observe that Figure 1's curve passes closest to all data points, matching the trend of the data better than the other curves.
Step2: Substitute x=40 into Figure1's equation
Use $y=0.28x^2 + 1.87x$, substitute $x=40$.
First calculate $x^2$: $40^2=1600$
Then compute each term:
$0.28\times1600 = 448$
$1.87\times40 = 74.8$
Sum the terms: $448 + 74.8 = 522.8$

Snap & solve any problem in the app
Get step-by-step solutions on Sovi AI
Photo-based solutions with guided steps
Explore more problems and detailed explanations
(a) Figure 1
(b) 522.8 meters