QUESTION IMAGE
Question
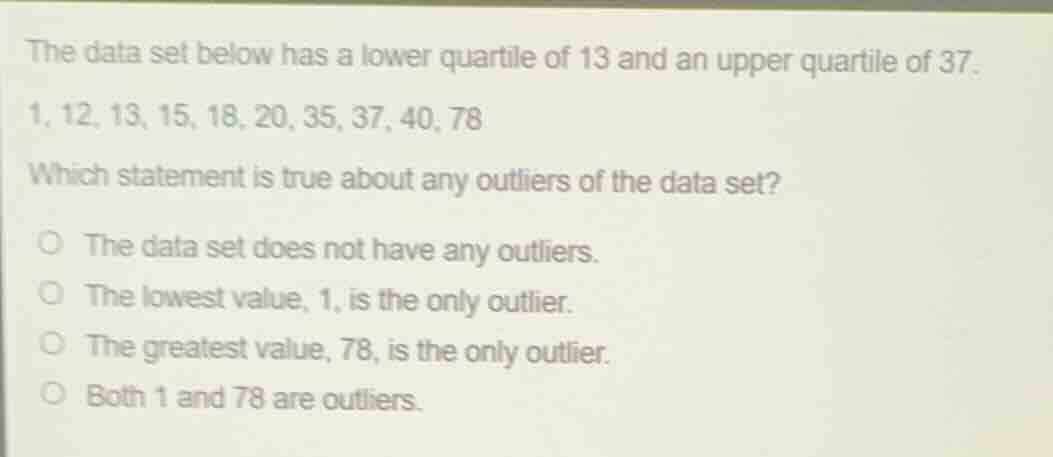
the data set below has a lower quartile of 13 and an upper quartile of 37.
1, 12, 13, 15, 18, 20, 35, 37, 40, 78
which statement is true about any outliers of the data set?
○ the data set does not have any outliers.
○ the lowest value, 1, is the only outlier.
○ the greatest value, 78, is the only outlier.
○ both 1 and 78 are outliers.
Step1: Calculate the interquartile range (IQR)
The interquartile range (IQR) is calculated as the difference between the upper quartile (Q3) and the lower quartile (Q1). Given \( Q1 = 13 \) and \( Q3 = 37 \), we have:
\( IQR = Q3 - Q1 = 37 - 13 = 24 \)
Step2: Determine the lower and upper bounds for outliers
The lower bound for outliers is calculated as \( Q1 - 1.5 \times IQR \), and the upper bound is \( Q3 + 1.5 \times IQR \).
- Lower bound: \( 13 - 1.5 \times 24 = 13 - 36 = -23 \)
- Upper bound: \( 37 + 1.5 \times 24 = 37 + 36 = 73 \)
Step3: Check each data point against the bounds
- For the value 1: Since \( -23 < 1 < 73 \), 1 is not an outlier.
- For the value 78: Since \( 78 > 73 \), 78 is an outlier.
- Other values (12, 13, 15, 18, 20, 35, 37, 40) are between -23 and 73, so they are not outliers.

Snap & solve any problem in the app
Get step-by-step solutions on Sovi AI
Photo-based solutions with guided steps
Explore more problems and detailed explanations
The greatest value, 78, is the only outlier.