QUESTION IMAGE
Question
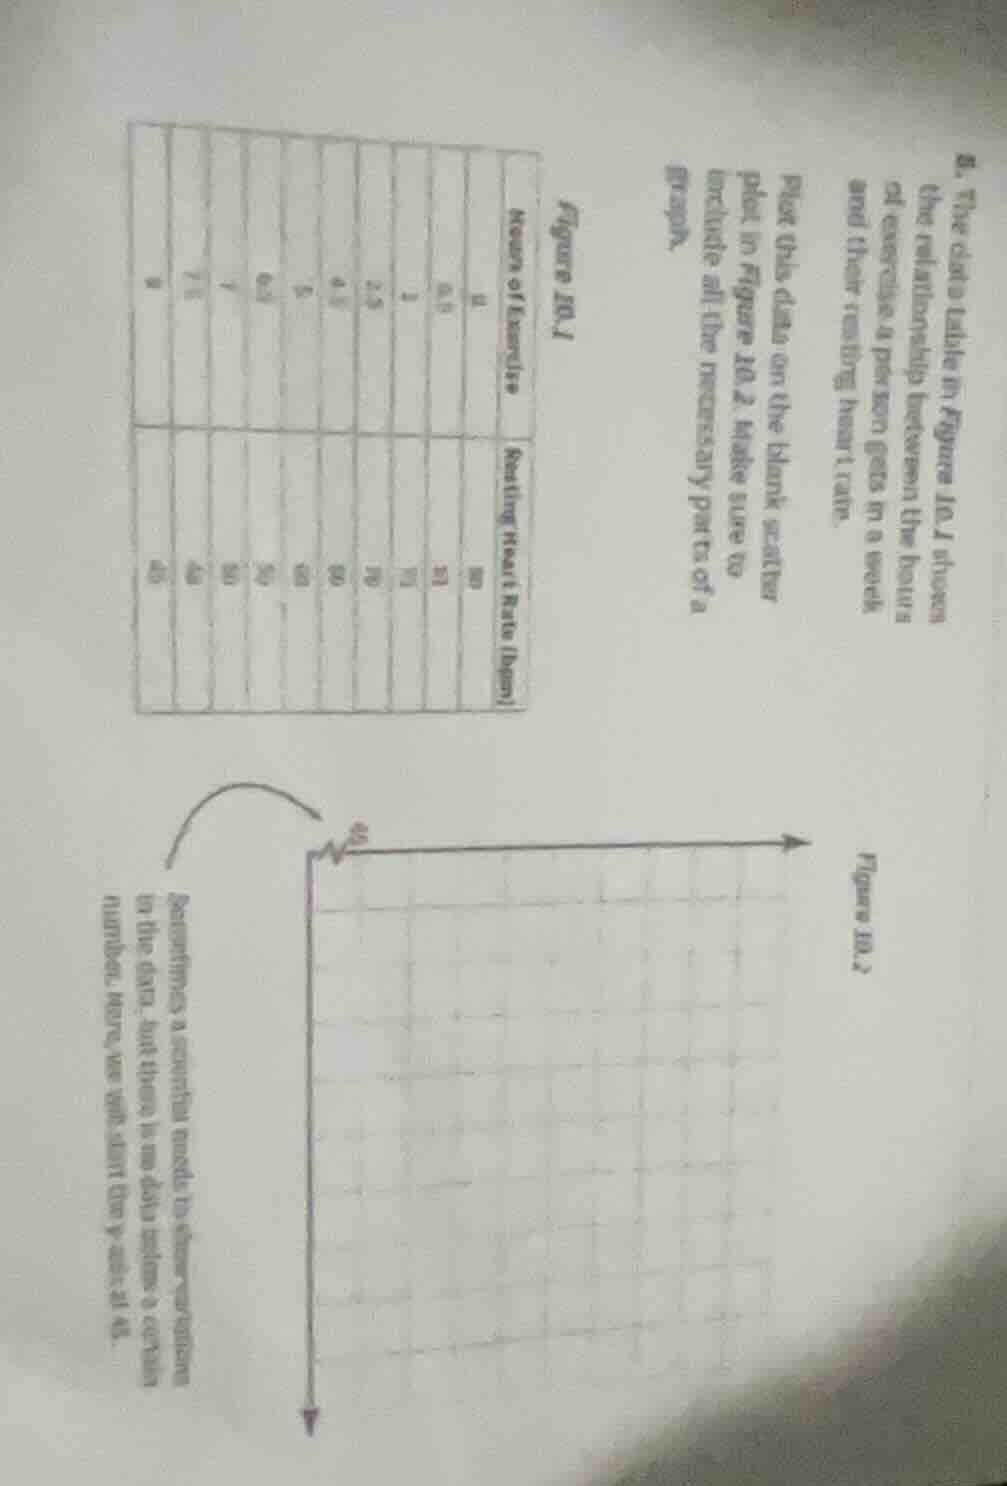
- the data table in figure 10.1 shows the relationship between the hours of exercise a person gets in a week and their resting heart rate. plot this data on the blank scatter plot in figure 10.2. make sure to include all the necessary parts of a graph. figure 10.1 hours of exercise | resting heart rate (bpm) 0 | 80 0.5 | 81 1 | 73 2.5 | 70 4 | 65 6 | 55 6.5 | 50 7 | 45 8 | 40 sometimes a careful scale is shown in the data, but there is no data below a certain number, so we start the y - axis at 45.
Step1: Label axes (x=exercise, y=heart rate)
X-axis: Hours of Exercise per Week; Y-axis: Resting Heart Rate (bpm)
Step2: Set axis scales
X-axis: 0, 2, 4, 6, 8 (interval 2)
Y-axis: 45, 50, 55, 60, 65, 70, 75, 80 (interval 5)
Step3: Plot each data point
$(0, 80), (0.5, 78), (2, 75), (2.5, 70), (4.5, 68), (5, 62), (6.5, 58), (7, 55), (7.5, 48), (9, 45)$
Step4: Add graph title
Title: Resting Heart Rate vs Weekly Exercise Hours

Snap & solve any problem in the app
Get step-by-step solutions on Sovi AI
Photo-based solutions with guided steps
Explore more problems and detailed explanations
A scatter plot with:
- X-axis labeled "Hours of Exercise per Week" (scaled 0 to 9, interval 2)
- Y-axis labeled "Resting Heart Rate (bpm)" (scaled 45 to 80, interval 5)
- Plotted data points: $(0, 80), (0.5, 78), (2, 75), (2.5, 70), (4.5, 68), (5, 62), (6.5, 58), (7, 55), (7.5, 48), (9, 45)$
- Title: "Resting Heart Rate vs Weekly Exercise Hours"